This notebook illustrates two examples of fitting structural time series models to time-series and using them to generate forecasts and explanations.
|---|---|---|---|
| [View on TensorFlow.org](https://www.tensorflow.org/probability/examples/Structural_Time_Series_Modeling_Case_Studies_Atmospheric_CO2_and_Electricity_Demand_JAX) | [Run in Google Colab](https://colab.research.google.com/github/tensorflow/probability/blob/main/tensorflow_probability/examples/jupyter_notebooks/Structural_Time_Series_Modeling_Case_Studies_Atmospheric_CO2_and_Electricity_Demand_JAX.ipynb) | [View source on GitHub](https://github.com/tensorflow/probability/blob/main/tensorflow_probability/examples/jupyter_notebooks/Structural_Time_Series_Modeling_Case_Studies_Atmospheric_CO2_and_Electricity_Demand_JAX.ipynb) | [Download notebook](https://storage.googleapis.com/tensorflow_docs/probability/tensorflow_probability/examples/jupyter_notebooks/Structural_Time_Series_Modeling_Case_Studies_Atmospheric_CO2_and_Electricity_Demand_JAX.ipynb) |
### Dependencies \& Prerequisites
### Import and set ups
%matplotlib inline
import matplotlib as mpl
from matplotlib import pylab as plt
import matplotlib.dates as mdates
import seaborn as sns
import collections
import numpy as np
import jax
from jax import config
config.update('jax_enable_x64', True)
from tensorflow_probability.substrates import jax as tfp
import jax.numpy as jnp
import optax
tfd = tfp.distributions
sts = tfp.sts
### Make things Fast!
Before we dive in, let's make sure we're using a GPU for this demo.
To do this, select "Runtime" -\> "Change runtime type" -\> "Hardware accelerator" -\> "GPU".
The following snippet will verify that we have access to a GPU.
if jax.default_backend() != 'gpu':
print('WARNING: GPU device not found.')
else:
print('SUCCESS: Found GPU.')
```
SUCCESS: Found GPU.
```
> [!NOTE]
> **Note:** if for some reason you cannot access a GPU, this colab will still work. (Training will just take longer.)
### Plotting setup
Helper methods for plotting time series and forecasts.
from pandas.plotting import register_matplotlib_converters
register_matplotlib_converters()
sns.set_context("notebook", font_scale=1.)
sns.set_style("whitegrid")
%config InlineBackend.figure_format = 'retina'
def plot_forecast(x, y,
forecast_mean, forecast_scale, forecast_samples,
title, x_locator=None, x_formatter=None):
"""Plot a forecast distribution against the 'true' time series."""
colors = sns.color_palette()
c1, c2 = colors[0], colors[1]
fig = plt.figure(figsize=(12, 6))
ax = fig.add_subplot(1, 1, 1)
num_steps = len(y)
num_steps_forecast = forecast_mean.shape[-1]
num_steps_train = num_steps - num_steps_forecast
ax.plot(x, y, lw=2, color=c1, label='ground truth')
forecast_steps = np.arange(
x[num_steps_train],
x[num_steps_train]+num_steps_forecast,
dtype=x.dtype)
ax.plot(forecast_steps, forecast_samples.T, lw=1, color=c2, alpha=0.1)
ax.plot(forecast_steps, forecast_mean, lw=2, ls='--', color=c2,
label='forecast')
ax.fill_between(forecast_steps,
forecast_mean-2*forecast_scale,
forecast_mean+2*forecast_scale, color=c2, alpha=0.2)
ymin, ymax = min(jnp.min(forecast_samples), jnp.min(y)), max(jnp.max(forecast_samples), jnp.max(y))
yrange = ymax-ymin
ax.set_ylim([ymin - yrange*0.1, ymax + yrange*0.1])
ax.set_title("{}".format(title))
ax.legend()
if x_locator is not None:
ax.xaxis.set_major_locator(x_locator)
ax.xaxis.set_major_formatter(x_formatter)
fig.autofmt_xdate()
return fig, ax
def plot_components(dates,
component_means_dict,
component_stddevs_dict,
x_locator=None,
x_formatter=None):
"""Plot the contributions of posterior components in a single figure."""
colors = sns.color_palette()
c1, c2 = colors[0], colors[1]
axes_dict = collections.OrderedDict()
num_components = len(component_means_dict)
fig = plt.figure(figsize=(12, 2.5 * num_components))
for i, component_name in enumerate(component_means_dict.keys()):
component_mean = component_means_dict[component_name]
component_stddev = component_stddevs_dict[component_name]
ax = fig.add_subplot(num_components,1,1+i)
ax.plot(dates, component_mean, lw=2)
ax.fill_between(dates,
component_mean-2*component_stddev,
component_mean+2*component_stddev,
color=c2, alpha=0.5)
ax.set_title(component_name)
if x_locator is not None:
ax.xaxis.set_major_locator(x_locator)
ax.xaxis.set_major_formatter(x_formatter)
axes_dict[component_name] = ax
fig.autofmt_xdate()
fig.tight_layout()
return fig, axes_dict
def plot_one_step_predictive(dates, observed_time_series,
one_step_mean, one_step_scale,
x_locator=None, x_formatter=None):
"""Plot a time series against a model's one-step predictions."""
colors = sns.color_palette()
c1, c2 = colors[0], colors[1]
fig=plt.figure(figsize=(12, 6))
ax = fig.add_subplot(1,1,1)
num_timesteps = one_step_mean.shape[-1]
ax.plot(dates, observed_time_series, label="observed time series", color=c1)
ax.plot(dates, one_step_mean, label="one-step prediction", color=c2)
ax.fill_between(dates,
one_step_mean - one_step_scale,
one_step_mean + one_step_scale,
alpha=0.1, color=c2)
ax.legend()
if x_locator is not None:
ax.xaxis.set_major_locator(x_locator)
ax.xaxis.set_major_formatter(x_formatter)
fig.autofmt_xdate()
fig.tight_layout()
return fig, ax
## Mauna Loa CO2 record
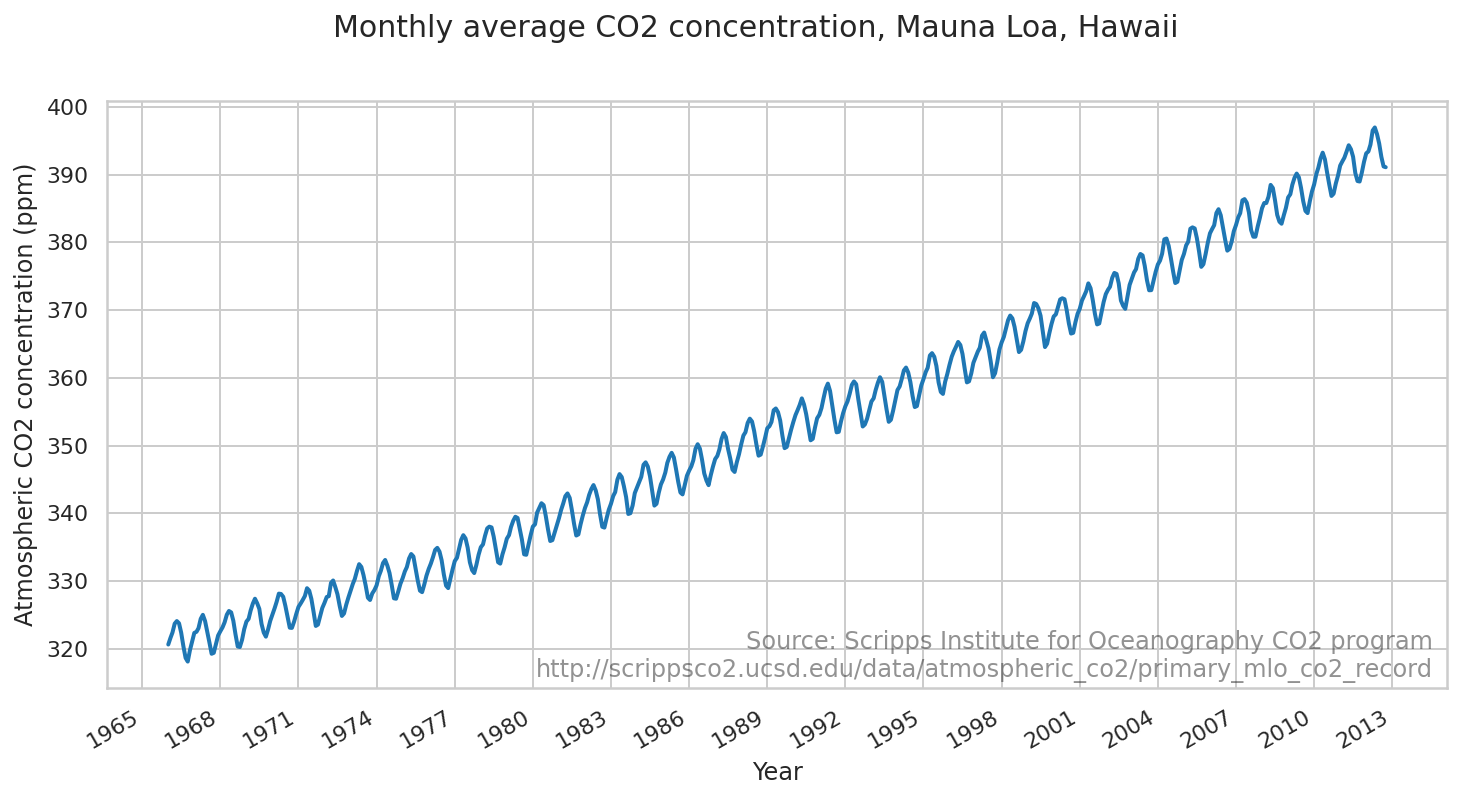
We'll demonstrate fitting a model to the atmospheric CO2 readings from the Mauna Loa observatory.
### Data
# CO2 readings from Mauna Loa observatory, monthly beginning January 1966
# Original source: http://scrippsco2.ucsd.edu/data/atmospheric_co2/primary_mlo_co2_record
co2_by_month = np.array('320.62,321.6,322.39,323.7,324.08,323.75,322.37,320.36,318.64,318.1,319.78,321.02,322.33,322.5,323.03,324.41,325,324.09,322.54,320.92,319.25,319.39,320.72,321.95,322.57,323.15,323.89,325.02,325.57,325.36,324.14,322.11,320.33,320.25,321.32,322.89,324,324.41,325.63,326.66,327.38,326.71,325.88,323.66,322.38,321.78,322.85,324.11,325.06,325.99,326.93,328.13,328.08,327.67,326.34,324.68,323.1,323.07,324.01,325.13,326.17,326.68,327.18,327.78,328.93,328.57,327.36,325.43,323.36,323.56,324.8,326.01,326.77,327.63,327.75,329.72,330.07,329.09,328.04,326.32,324.84,325.2,326.5,327.55,328.55,329.56,330.3,331.5,332.48,332.07,330.87,329.31,327.52,327.19,328.16,328.65,329.36,330.71,331.49,332.65,333.1,332.26,331.18,329.4,327.44,327.38,328.46,329.58,330.41,331.41,332.05,333.32,333.98,333.62,331.91,330.06,328.57,328.35,329.5,330.77,331.76,332.58,333.5,334.59,334.89,334.34,333.06,330.95,329.31,328.95,330.32,331.69,332.94,333.43,334.71,336.08,336.76,336.28,334.93,332.76,331.6,331.17,332.41,333.86,334.98,335.4,336.65,337.76,338.02,337.91,336.55,334.69,332.77,332.56,333.93,334.96,336.24,336.77,337.97,338.89,339.48,339.3,337.74,336.1,333.93,333.87,335.3,336.74,338.03,338.37,340.09,340.78,341.48,341.19,339.57,337.61,335.9,336.03,337.12,338.23,339.25,340.5,341.4,342.52,342.93,342.27,340.5,338.45,336.71,336.88,338.38,339.63,340.77,341.63,342.72,343.59,344.16,343.37,342.07,339.83,338,337.88,339.28,340.51,341.4,342.54,343.12,344.96,345.78,345.34,344,342.4,339.89,340.01,341.16,342.98,343.82,344.62,345.38,347.15,347.52,346.88,345.47,343.34,341.13,341.4,343.02,344.25,344.99,346.01,347.43,348.34,348.92,348.24,346.54,344.64,343.06,342.78,344.21,345.53,346.28,346.93,347.83,349.53,350.19,349.54,347.92,345.88,344.83,344.15,345.64,346.88,348,348.47,349.41,350.97,351.84,351.25,349.5,348.08,346.44,346.1,347.54,348.69,350.16,351.47,351.96,353.33,353.97,353.55,352.14,350.19,348.5,348.66,349.85,351.12,352.55,352.86,353.48,355.21,355.47,354.92,353.7,351.47,349.61,349.79,351.09,352.32,353.46,354.5,355.19,356,356.96,356.04,354.62,352.71,350.77,350.99,352.64,354.02,354.53,355.55,356.96,358.4,359.14,358.04,355.98,353.81,351.95,352.02,353.55,354.79,355.79,356.52,357.61,358.95,359.46,359.05,356.82,354.8,352.81,353.11,353.96,355.2,356.5,356.97,358.18,359.26,360.08,359.4,357.38,355.33,353.5,353.8,355.15,356.62,358.19,358.73,359.79,361.09,361.51,360.78,359.38,357.31,355.68,355.83,357.42,358.87,359.81,360.84,361.48,363.3,363.64,363.11,361.75,359.31,357.91,357.62,359.42,360.56,361.91,363.11,363.89,364.58,365.29,364.84,363.52,361.35,359.32,359.48,360.64,362.21,363.06,363.87,364.44,366.23,366.68,365.52,364.36,362.39,360.08,360.67,362.32,364.17,365.22,366.04,367.2,368.5,369.19,368.77,367.53,365.67,363.8,364.13,365.36,366.87,368.05,368.77,369.49,371.04,370.9,370.25,369.17,366.83,364.54,365.04,366.58,367.92,369.05,369.37,370.42,371.57,371.74,371.6,370.02,368.03,366.53,366.64,368.2,369.44,370.2,371.42,372.04,372.78,373.94,373.23,371.54,369.47,367.88,368.02,369.6,371.16,372.36,373,373.44,374.77,375.48,375.33,373.95,371.41,370.63,370.18,372.01,373.71,374.61,375.55,376.04,377.58,378.28,378.07,376.54,374.42,372.92,372.94,374.29,375.63,376.73,377.31,378.33,380.44,380.56,379.49,377.71,375.77,373.99,374.17,375.79,377.39,378.29,379.56,380.07,382.01,382.21,382.05,380.63,378.64,376.38,376.77,378.27,379.92,381.33,381.98,382.53,384.33,384.89,384,382.25,380.44,378.77,379.03,380.11,381.63,382.55,383.68,384.31,386.2,386.38,385.85,384.42,381.81,380.83,380.83,382.32,383.58,385.04,385.81,385.8,386.74,388.48,388.02,386.22,384.05,383.05,382.75,383.98,385.08,386.63,387.1,388.5,389.54,390.15,389.6,388.05,386.06,384.64,384.32,386.05,387.48,388.55,390.08,391.02,392.39,393.24,392.26,390.35,388.53,386.85,387.18,388.69,389.83,391.33,391.96,392.49,393.4,394.33,393.75,392.64,390.25,389.05,388.98,390.3,391.86,393.13,393.42,394.43,396.51,396.96,395.97,394.6,392.61,391.2,391.09,393.03,394.42,395.69,396.94,397.35,398.44,400.06,398.96,397.45,395.49,393.47,393.77,395.27,396.9,398.01,398.18,399.56,401.44,401.98,401.41,399.17,397.3,395.49,395.74,397.32,398.88,399.94,400.4,401.6,403.52,404.03,402.81,401.54,398.93,397.43,398.22,400.17,401.82,402.58,404.09,404.79,407.5,407.59,406.94,404.43,402.17,400.95,401.43,403.57,404.48,406,406.57,406.99,408.88,409.84,409.05,407.13,405.17,403.2,403.57,405.1,406.68,407.98,408.36,409.21,410.24,411.23,410.81,408.83,407.02,405.53,405.93,408.04,409.17,410.85,411.59,411.91,413.46,414.76,413.89,411.78,410.01,408.48,408.4,410.16,411.81,413.3,414.05,414.45,416.11,417.15,416.29,414.42,412.52,411.18,411.12,412.88,413.89,415.15,416.47,417.16,418.24,418.95,418.7,416.65,414.34,412.91,413.55,414.82,416.43,418.01,418.99,418.45,420.02,420.77,420.68,418.68,416.76,415.41,415.31'.split(',')).astype(np.float32)
co2_by_month = co2_by_month
num_forecast_steps = 12 * 10 # Forecast the final ten years, given previous data
co2_by_month_training_data = co2_by_month[:-num_forecast_steps]
co2_dates = np.arange("1966-01", "2022-11", dtype="datetime64[M]")
co2_loc = mdates.YearLocator(3)
co2_fmt = mdates.DateFormatter('%Y')
fig = plt.figure(figsize=(12, 6))
ax = fig.add_subplot(1, 1, 1)
ax.plot(co2_dates[:-num_forecast_steps], co2_by_month_training_data, lw=2, label="training data")
ax.xaxis.set_major_locator(co2_loc)
ax.xaxis.set_major_formatter(co2_fmt)
ax.set_ylabel("Atmospheric CO2 concentration (ppm)")
ax.set_xlabel("Year")
fig.suptitle("Monthly average CO2 concentration, Mauna Loa, Hawaii",
fontsize=15)
ax.text(0.99, .02,
"Source: Scripps Institute for Oceanography CO2 program\nhttp://scrippsco2.ucsd.edu/data/atmospheric_co2/primary_mlo_co2_record",
transform=ax.transAxes,
horizontalalignment="right",
alpha=0.5)
fig.autofmt_xdate()
### Model and Fitting
We'll model this series with a local linear trend, plus a month-of-year seasonal effect.
def build_model(observed_time_series):
trend = sts.LocalLinearTrend(observed_time_series=observed_time_series)
seasonal = tfp.sts.Seasonal(
num_seasons=12, observed_time_series=observed_time_series)
model = sts.Sum([trend, seasonal], observed_time_series=observed_time_series)
return model
We'll fit the model using variational inference. This involves running an optimizer to minimize a variational loss function, the negative evidence lower bound (ELBO). This fits a set of approximate posterior distributions for the parameters (in practice we assume these to be independent Normals transformed to the support space of each parameter).
The [`tfp.sts`](https://www.tensorflow.org/probability/api_docs/python/tfp/sts) forecasting methods require posterior samples as inputs, so we'll finish by drawing a set of samples from the variational posterior.
co2_model = build_model(co2_by_month_training_data)
# Build the variational surrogate posteriors `qs`.
init_fn, build_surrogate_fn = (
tfp.sts.build_factored_surrogate_posterior_stateless(model=co2_model))
### Minimize the variational loss.
# Allow external control of optimization to reduce test runtimes.
num_variational_steps = 200 # @param { isTemplate: true}
num_variational_steps = int(num_variational_steps)
seed = jax.random.PRNGKey(42)
init_seed, fit_seed, sample_seed = jax.random.split(seed, 3)
initial_parameters = init_fn(init_seed)
jd = co2_model.joint_distribution(co2_by_month_training_data)
# Build and optimize the variational loss function.
optimized_parameters, elbo_loss_curve = tfp.vi.fit_surrogate_posterior_stateless(
target_log_prob_fn=jd.log_prob,
initial_parameters=initial_parameters,
build_surrogate_posterior_fn=build_surrogate_fn,
optimizer=optax.adam(0.1),
num_steps=num_variational_steps,
seed=fit_seed)
plt.plot(elbo_loss_curve)
plt.show()
# Draw samples from the variational posterior.
variational_posteriors = build_surrogate_fn(optimized_parameters)
q_samples_co2_ = variational_posteriors.sample(50, seed=sample_seed)

print("Inferred parameters:")
for param in co2_model.parameters:
print("{}: {} +- {}".format(param.name,
jnp.mean(q_samples_co2_[param.name], axis=0),
jnp.std(q_samples_co2_[param.name], axis=0)))
```
Inferred parameters:
observation_noise_scale: 0.1685197800397873 +- 0.007219966035336256
LocalLinearTrend_level_scale: 0.18049846589565277 +- 0.011273686774075031
LocalLinearTrend_slope_scale: 0.009398984722793102 +- 0.0021420123521238565
Seasonal_drift_scale: 0.03475992754101753 +- 0.005793483462184668
```
### Forecasting and criticism
Now let's use the fitted model to construct a forecast. We just call [`tfp.sts.forecast`](https://www.tensorflow.org/probability/api_docs/python/tfp/sts/forecast), which returns a TensorFlow Distribution instance representing the predictive distribution over future timesteps.
co2_forecast_dist = tfp.sts.forecast(
co2_model,
observed_time_series=co2_by_month_training_data,
parameter_samples=q_samples_co2_,
num_steps_forecast=num_forecast_steps)
In particular, the `mean` and `stddev` of the forecast distribution give us a prediction with marginal uncertainty at each timestep, and we can also draw samples of possible futures.
num_samples=10
co2_forecast_mean, co2_forecast_scale, co2_forecast_samples = (
co2_forecast_dist.mean()[..., 0],
co2_forecast_dist.stddev()[..., 0],
co2_forecast_dist.sample(num_samples, seed=sample_seed)[..., 0])
fig, ax = plot_forecast(
co2_dates, co2_by_month,
co2_forecast_mean, co2_forecast_scale, co2_forecast_samples,
x_locator=co2_loc,
x_formatter=co2_fmt,
title="Atmospheric CO2 forecast")
ax.axvline(co2_dates[-num_forecast_steps], linestyle="--")
ax.legend(loc="upper left")
ax.set_ylabel("Atmospheric CO2 concentration (ppm)")
ax.set_xlabel("Year")
fig.autofmt_xdate()

We can further understand the model's fit by decomposing it into the contributions of individual time series:
# Build a dict mapping components to distributions over
# their contribution to the observed signal.
component_dists = sts.decompose_by_component(
co2_model,
observed_time_series=co2_by_month,
parameter_samples=q_samples_co2_)
co2_component_means_, co2_component_stddevs_ = (
{k.name: c.mean() for k, c in component_dists.items()},
{k.name: c.stddev() for k, c in component_dists.items()})
_ = plot_components(co2_dates, co2_component_means_, co2_component_stddevs_,
x_locator=co2_loc, x_formatter=co2_fmt)

## Electricity demand forecasting
Now let's consider a more complex example: forecasting electricity demand in Victoria Australia.
First, we'll build the dataset:
# Victoria electricity demand dataset, as presented at
# https://otexts.com/fpp2/scatterplots.html
# and downloaded from https://github.com/robjhyndman/fpp2-package/blob/master/data/elecdaily.rda
# This series contains the first eight weeks (starting Jan 1). The original
# dataset was half-hourly data; here we've downsampled to hourly data by taking
# every other timestep.
demand_dates = np.arange('2014-01-01', '2014-02-26', dtype='datetime64[h]')
demand_loc = mdates.WeekdayLocator(byweekday=mdates.WE)
demand_fmt = mdates.DateFormatter('%a %b %d')
demand = np.array("3.794,3.418,3.152,3.026,3.022,3.055,3.180,3.276,3.467,3.620,3.730,3.858,3.851,3.839,3.861,3.912,4.082,4.118,4.011,3.965,3.932,3.693,3.585,4.001,3.623,3.249,3.047,3.004,3.104,3.361,3.749,3.910,4.075,4.165,4.202,4.225,4.265,4.301,4.381,4.484,4.552,4.440,4.233,4.145,4.116,3.831,3.712,4.121,3.764,3.394,3.159,3.081,3.216,3.468,3.838,4.012,4.183,4.269,4.280,4.310,4.315,4.233,4.188,4.263,4.370,4.308,4.182,4.075,4.057,3.791,3.667,4.036,3.636,3.283,3.073,3.003,3.023,3.113,3.335,3.484,3.697,3.723,3.786,3.763,3.748,3.714,3.737,3.828,3.937,3.929,3.877,3.829,3.950,3.756,3.638,4.045,3.682,3.283,3.036,2.933,2.956,2.959,3.157,3.236,3.370,3.493,3.516,3.555,3.570,3.656,3.792,3.950,3.953,3.926,3.849,3.813,3.891,3.683,3.562,3.936,3.602,3.271,3.085,3.041,3.201,3.570,4.123,4.307,4.481,4.533,4.545,4.524,4.470,4.457,4.418,4.453,4.539,4.473,4.301,4.260,4.276,3.958,3.796,4.180,3.843,3.465,3.246,3.203,3.360,3.808,4.328,4.509,4.598,4.562,4.566,4.532,4.477,4.442,4.424,4.486,4.579,4.466,4.338,4.270,4.296,4.034,3.877,4.246,3.883,3.520,3.306,3.252,3.387,3.784,4.335,4.465,4.529,4.536,4.589,4.660,4.691,4.747,4.819,4.950,4.994,4.798,4.540,4.352,4.370,4.047,3.870,4.245,3.848,3.509,3.302,3.258,3.419,3.809,4.363,4.605,4.793,4.908,5.040,5.204,5.358,5.538,5.708,5.888,5.966,5.817,5.571,5.321,5.141,4.686,4.367,4.618,4.158,3.771,3.555,3.497,3.646,4.053,4.687,5.052,5.342,5.586,5.808,6.038,6.296,6.548,6.787,6.982,7.035,6.855,6.561,6.181,5.899,5.304,4.795,4.862,4.264,3.820,3.588,3.481,3.514,3.632,3.857,4.116,4.375,4.462,4.460,4.422,4.398,4.407,4.480,4.621,4.732,4.735,4.572,4.385,4.323,4.069,3.940,4.247,3.821,3.416,3.220,3.124,3.132,3.181,3.337,3.469,3.668,3.788,3.834,3.894,3.964,4.109,4.275,4.472,4.623,4.703,4.594,4.447,4.459,4.137,3.913,4.231,3.833,3.475,3.302,3.279,3.519,3.975,4.600,4.864,5.104,5.308,5.542,5.759,6.005,6.285,6.617,6.993,7.207,7.095,6.839,6.387,6.048,5.433,4.904,4.959,4.425,4.053,3.843,3.823,4.017,4.521,5.229,5.802,6.449,6.975,7.506,7.973,8.359,8.596,8.794,9.030,9.090,8.885,8.525,8.147,7.797,6.938,6.215,6.123,5.495,5.140,4.896,4.812,5.024,5.536,6.293,7.000,7.633,8.030,8.459,8.768,9.000,9.113,9.155,9.173,9.039,8.606,8.095,7.617,7.208,6.448,5.740,5.718,5.106,4.763,4.610,4.566,4.737,5.204,5.988,6.698,7.438,8.040,8.484,8.837,9.052,9.114,9.214,9.307,9.313,9.006,8.556,8.275,7.911,7.077,6.348,6.175,5.455,5.041,4.759,4.683,4.908,5.411,6.199,6.923,7.593,8.090,8.497,8.843,9.058,9.159,9.231,9.253,8.852,7.994,7.388,6.735,6.264,5.690,5.227,5.220,4.593,4.213,3.984,3.891,3.919,4.031,4.287,4.558,4.872,4.963,5.004,5.017,5.057,5.064,5.000,5.023,5.007,4.923,4.740,4.586,4.517,4.236,4.055,4.337,3.848,3.473,3.273,3.198,3.204,3.252,3.404,3.560,3.767,3.896,3.934,3.972,3.985,4.032,4.122,4.239,4.389,4.499,4.406,4.356,4.396,4.106,3.914,4.265,3.862,3.546,3.360,3.359,3.649,4.180,4.813,5.086,5.301,5.384,5.434,5.470,5.529,5.582,5.618,5.636,5.561,5.291,5.000,4.840,4.767,4.364,4.160,4.452,4.011,3.673,3.503,3.483,3.695,4.213,4.810,5.028,5.149,5.182,5.208,5.179,5.190,5.220,5.202,5.216,5.232,5.019,4.828,4.686,4.657,4.304,4.106,4.389,3.955,3.643,3.489,3.479,3.695,4.187,4.732,4.898,4.997,5.001,5.022,5.052,5.094,5.143,5.178,5.250,5.255,5.075,4.867,4.691,4.665,4.352,4.121,4.391,3.966,3.615,3.437,3.430,3.666,4.149,4.674,4.851,5.011,5.105,5.242,5.378,5.576,5.790,6.030,6.254,6.340,6.253,6.039,5.736,5.490,4.936,4.580,4.742,4.230,3.895,3.712,3.700,3.906,4.364,4.962,5.261,5.463,5.495,5.477,5.394,5.250,5.159,5.081,5.083,5.038,4.857,4.643,4.526,4.428,4.141,3.975,4.290,3.809,3.423,3.217,3.132,3.192,3.343,3.606,3.803,3.963,3.998,3.962,3.894,3.814,3.776,3.808,3.914,4.033,4.079,4.027,3.974,4.057,3.859,3.759,4.132,3.716,3.325,3.111,3.030,3.046,3.096,3.254,3.390,3.606,3.718,3.755,3.768,3.768,3.834,3.957,4.199,4.393,4.532,4.516,4.380,4.390,4.142,3.954,4.233,3.795,3.425,3.209,3.124,3.177,3.288,3.498,3.715,4.092,4.383,4.644,4.909,5.184,5.518,5.889,6.288,6.643,6.729,6.567,6.179,5.903,5.278,4.788,4.885,4.363,4.011,3.823,3.762,3.998,4.598,5.349,5.898,6.487,6.941,7.381,7.796,8.185,8.522,8.825,9.103,9.198,8.889,8.174,7.214,6.481,5.611,5.026,5.052,4.484,4.148,3.955,3.873,4.060,4.626,5.272,5.441,5.535,5.534,5.610,5.671,5.724,5.793,5.838,5.908,5.868,5.574,5.276,5.065,4.976,4.554,4.282,4.547,4.053,3.720,3.536,3.524,3.792,4.420,5.075,5.208,5.344,5.482,5.701,5.936,6.210,6.462,6.683,6.979,7.059,6.893,6.535,6.121,5.797,5.152,4.705,4.805,4.272,3.975,3.805,3.775,3.996,4.535,5.275,5.509,5.730,5.870,6.034,6.175,6.340,6.500,6.603,6.804,6.787,6.460,6.043,5.627,5.367,4.866,4.575,4.728,4.157,3.795,3.607,3.537,3.596,3.803,4.125,4.398,4.660,4.853,5.115,5.412,5.669,5.930,6.216,6.466,6.641,6.605,6.316,5.821,5.520,5.016,4.657,4.746,4.197,3.823,3.613,3.505,3.488,3.532,3.716,4.011,4.421,4.836,5.296,5.766,6.233,6.646,7.011,7.380,7.660,7.804,7.691,7.364,7.019,6.260,5.545,5.437,4.806,4.457,4.235,4.172,4.396,5.002,5.817,6.266,6.732,7.049,7.184,7.085,6.798,6.632,6.408,6.218,5.968,5.544,5.217,4.964,4.758,4.328,4.074,4.367,3.883,3.536,3.404,3.396,3.624,4.271,4.916,4.953,5.016,5.048,5.106,5.124,5.200,5.244,5.242,5.341,5.368,5.166,4.910,4.762,4.700,4.276,4.035,4.318,3.858,3.550,3.399,3.382,3.590,4.261,4.937,4.994,5.094,5.168,5.303,5.410,5.571,5.740,5.900,6.177,6.274,6.039,5.700,5.389,5.192,4.672,4.359,4.614,4.118,3.805,3.627,3.646,3.882,4.470,5.106,5.274,5.507,5.711,5.950,6.200,6.527,6.884,7.196,7.615,7.845,7.759,7.437,7.059,6.584,5.742,5.125,5.139,4.564,4.218,4.025,4.000,4.245,4.783,5.504,5.920,6.271,6.549,6.894,7.231,7.535,7.597,7.562,7.609,7.534,7.118,6.448,5.963,5.565,5.005,4.666,4.850,4.302,3.905,3.678,3.610,3.672,3.869,4.204,4.541,4.944,5.265,5.651,6.090,6.547,6.935,7.318,7.625,7.793,7.760,7.510,7.145,6.805,6.103,5.520,5.462,4.824,4.444,4.237,4.157,4.164,4.275,4.545,5.033,5.594,6.176,6.681,6.628,6.238,6.039,5.897,5.832,5.701,5.483,4.949,4.589,4.407,4.027,3.820,4.075,3.650,3.388,3.271,3.268,3.498,4.086,4.800,4.933,5.102,5.126,5.194,5.260,5.319,5.364,5.419,5.559,5.568,5.332,5.027,4.864,4.738,4.303,4.093,4.379,3.952,3.632,3.461,3.446,3.732,4.294,4.911,5.021,5.138,5.223,5.348,5.479,5.661,5.832,5.966,6.178,6.212,5.949,5.640,5.449,5.213,4.678,4.376,4.601,4.147,3.815,3.610,3.605,3.879,4.468,5.090,5.226,5.406,5.561,5.740,5.899,6.095,6.272,6.402,6.610,6.585,6.265,5.925,5.747,5.497,4.932,4.580,4.763,4.298,4.026,3.871,3.827,4.065,4.643,5.317,5.494,5.685,5.814,5.912,5.999,6.097,6.176,6.136,6.131,6.049,5.796,5.532,5.475,5.254,4.742,4.453,4.660,4.176,3.895,3.726,3.717,3.910,4.479,5.135,5.306,5.520,5.672,5.737,5.785,5.829,5.893,5.892,5.921,5.817,5.557,5.304,5.234,5.074,4.656,4.396,4.599,4.064,3.749,3.560,3.475,3.552,3.783,4.045,4.258,4.539,4.762,4.938,5.049,5.037,5.066,5.151,5.197,5.201,5.132,4.908,4.725,4.568,4.222,3.939,4.215,3.741,3.380,3.174,3.076,3.071,3.172,3.328,3.427,3.603,3.738,3.765,3.777,3.705,3.690,3.742,3.859,4.032,4.113,4.032,4.066,4.011,3.712,3.530,3.905,3.556,3.283,3.136,3.146,3.400,4.009,4.717,4.827,4.909,4.973,5.036,5.079,5.160,5.228,5.241,5.343,5.350,5.184,4.941,4.797,4.615,4.160,3.904,4.213,3.810,3.528,3.369,3.381,3.609,4.178,4.861,4.918,5.006,5.102,5.239,5.385,5.528,5.724,5.845,6.048,6.097,5.838,5.507,5.267,5.003,4.462,4.184,4.431,3.969,3.660,3.480,3.470,3.693,4.313,4.955,5.083,5.251,5.268,5.293,5.285,5.308,5.349,5.322,5.328,5.151,4.975,4.741,4.678,4.458,4.056,3.868,4.226,3.799,3.428,3.253,3.228,3.452,4.040,4.726,4.709,4.721,4.741,4.846,4.864,4.868,4.836,4.799,4.890,4.946,4.800,4.646,4.693,4.546,4.117,3.897,4.259,3.893,3.505,3.341,3.334,3.623,4.240,4.925,4.986,5.028,4.987,4.984,4.975,4.912,4.833,4.686,4.710,4.718,4.577,4.454,4.532,4.407,4.064,3.883,4.221,3.792,3.445,3.261,3.221,3.295,3.521,3.804,4.038,4.200,4.226,4.198,4.182,4.078,4.018,4.002,4.066,4.158,4.154,4.084,4.104,4.001,3.773,3.700,4.078,3.702,3.349,3.143,3.052,3.070,3.181,3.327,3.440,3.616,3.678,3.694,3.710,3.706,3.764,3.852,4.009,4.202,4.323,4.249,4.275,4.162,3.848,3.706,4.060,3.703,3.401,3.251,3.239,3.455,4.041,4.743,4.815,4.916,4.931,4.966,5.063,5.218,5.381,5.458,5.550,5.566,5.376,5.104,5.022,4.793,4.335,4.108,4.410,4.008,3.666,3.497,3.464,3.698,4.333,4.998,5.094,5.272,5.459,5.648,5.853,6.062,6.258,6.236,6.226,5.957,5.455,5.066,4.968,4.742,4.304,4.105,4.410".split(",")).astype(np.float32)
temperature = np.array("18.050,17.200,16.450,16.650,16.400,17.950,19.700,20.600,22.350,23.700,24.800,25.900,25.300,23.650,20.700,19.150,22.650,22.650,22.400,22.150,22.050,22.150,21.000,19.500,18.450,17.250,16.300,15.700,15.500,15.450,15.650,16.500,18.100,17.800,19.100,19.850,20.300,21.050,22.800,21.650,20.150,19.300,18.750,17.900,17.350,16.850,16.350,15.700,14.950,14.500,14.350,14.450,14.600,14.600,14.700,15.450,16.700,18.300,20.100,20.650,19.450,20.200,20.250,20.050,20.250,20.950,21.900,21.000,19.900,19.250,17.300,16.300,15.800,15.000,14.400,14.050,13.650,13.500,14.150,15.300,14.800,17.050,18.350,19.450,18.550,18.650,18.850,19.800,19.650,18.900,19.500,17.700,17.350,16.950,16.400,15.950,14.900,14.250,13.050,12.000,11.500,10.950,12.300,16.100,17.100,19.600,21.100,22.600,24.350,25.250,25.750,20.350,15.550,18.300,19.400,19.250,18.550,17.700,16.750,15.800,14.900,14.050,14.100,13.500,13.000,12.950,13.300,13.900,15.400,16.750,17.300,17.750,18.400,18.500,18.800,19.450,18.750,18.400,16.950,15.800,15.350,15.250,15.150,14.900,14.500,14.600,14.400,14.150,14.300,14.500,14.950,15.550,15.800,15.550,16.450,17.500,17.700,18.750,19.600,19.900,19.350,19.550,17.900,16.400,15.550,14.900,14.400,13.950,13.300,12.950,12.650,12.450,12.350,12.150,11.950,14.150,15.850,17.750,19.450,22.150,23.850,23.450,24.950,26.850,26.100,25.150,23.250,21.300,19.850,18.900,18.250,17.450,17.100,16.400,15.550,15.050,14.400,14.550,15.150,17.050,18.850,20.850,24.250,27.700,28.400,30.750,30.700,32.200,31.750,30.650,29.750,28.850,27.850,25.950,24.700,24.850,24.050,23.850,23.500,22.950,22.200,21.750,22.350,24.050,25.150,27.100,28.050,29.750,31.250,31.900,32.950,33.150,33.950,33.850,33.250,32.500,31.500,28.300,23.900,22.900,22.300,21.250,20.500,19.850,18.850,18.300,18.100,18.200,18.150,18.000,17.700,18.250,19.700,20.750,21.800,21.500,21.600,20.800,19.400,18.400,17.900,17.600,17.550,17.550,17.650,17.400,17.150,16.800,17.000,16.900,17.200,17.350,17.650,17.800,18.400,19.300,20.200,21.050,21.700,21.800,21.800,21.500,20.000,19.300,18.200,18.100,17.700,16.950,16.250,15.600,15.500,15.300,15.450,15.500,15.750,17.350,19.150,21.650,24.700,25.200,24.300,26.900,28.100,29.450,29.850,29.450,26.350,27.050,25.700,25.150,23.850,22.450,21.450,20.850,20.700,21.300,21.550,20.800,22.300,26.300,32.600,35.150,36.800,38.150,39.950,40.850,41.250,42.300,41.950,41.350,40.600,36.350,36.150,34.600,34.050,35.400,36.300,35.550,33.700,30.650,29.450,29.500,31.000,33.300,35.700,36.650,37.650,39.400,40.600,40.250,37.550,37.300,35.400,32.750,31.200,29.600,28.350,27.500,28.750,28.900,29.900,28.700,28.650,28.150,28.250,27.650,27.800,29.450,32.500,35.750,38.850,39.900,41.100,41.800,42.750,39.900,39.750,40.800,37.950,31.250,34.600,30.250,28.500,27.900,27.950,27.300,26.900,26.800,26.050,26.100,27.700,31.850,34.850,36.350,38.000,39.200,41.050,41.600,42.350,43.100,33.500,30.700,29.100,26.400,23.900,24.700,24.350,23.450,23.450,23.550,23.050,22.200,22.100,22.000,21.900,22.050,22.550,22.850,22.450,22.250,22.650,22.350,21.900,21.000,20.950,20.200,19.700,19.400,19.200,18.650,18.150,18.150,17.650,17.350,17.150,16.800,16.750,16.400,16.500,16.700,17.300,17.750,19.200,20.400,20.900,21.450,22.000,22.100,21.600,21.700,20.500,19.850,19.750,19.500,19.200,19.800,19.500,19.200,19.200,19.150,19.050,19.100,19.250,19.550,20.200,20.550,21.450,23.150,23.500,23.400,23.500,23.300,22.850,22.250,20.950,19.750,19.450,18.900,18.450,17.950,17.550,17.300,16.950,16.900,16.850,17.100,17.250,17.400,17.850,18.100,18.600,19.700,21.000,21.400,22.650,22.550,22.000,21.050,19.550,18.550,18.300,17.750,17.800,17.650,17.800,17.450,16.950,16.500,16.900,17.050,16.750,17.300,18.800,19.350,20.750,21.400,21.900,21.950,22.800,22.750,23.200,22.650,20.800,19.250,17.800,16.950,16.550,16.050,15.750,15.150,14.700,14.150,13.900,13.900,14.000,15.800,17.650,19.700,22.500,25.300,24.300,24.650,26.450,27.250,26.550,28.800,27.850,25.200,24.750,23.750,22.550,22.350,21.700,21.300,20.300,20.050,20.500,21.250,20.850,21.000,19.400,18.900,18.150,18.650,20.200,20.000,21.650,21.950,21.150,20.400,19.500,19.150,18.400,18.050,17.750,17.600,17.150,16.750,16.350,16.250,15.900,15.850,15.900,16.200,18.500,18.750,18.800,19.850,19.750,19.600,19.300,20.000,20.250,19.700,18.600,17.400,17.100,16.650,16.250,16.250,15.800,15.350,14.800,14.250,13.500,13.400,14.350,15.800,17.700,19.000,21.050,22.200,22.450,24.950,24.750,25.050,26.400,26.200,26.500,25.850,24.400,23.600,22.650,21.500,20.150,19.900,18.850,18.700,18.750,18.650,20.050,23.450,24.900,26.450,28.550,30.600,31.550,32.800,33.500,33.700,34.450,34.200,33.650,32.900,31.750,30.500,29.250,28.100,26.450,25.400,25.400,25.150,25.400,25.100,25.950,28.100,30.400,32.000,33.750,34.700,35.800,37.000,39.050,39.750,41.200,41.050,36.050,28.250,24.450,23.150,22.050,21.600,21.450,20.800,20.250,19.700,19.400,19.650,19.100,18.650,18.900,19.400,20.700,21.750,22.350,24.100,23.350,24.400,22.950,22.400,20.950,19.600,18.900,18.000,17.400,16.800,16.550,16.300,16.250,16.750,16.700,17.100,17.500,18.150,18.850,20.650,22.600,25.600,28.500,26.750,27.200,27.300,27.500,27.000,25.450,24.500,23.850,23.200,22.550,21.850,21.050,20.200,19.950,20.400,20.300,20.100,20.450,20.900,21.450,21.800,23.250,24.100,25.200,25.550,25.900,25.450,26.050,25.350,23.900,22.250,22.000,21.700,21.450,20.550,19.000,18.850,18.700,19.050,19.350,19.350,19.450,19.600,20.550,22.400,24.550,26.900,27.950,28.500,28.200,29.050,28.700,28.800,27.150,24.900,23.500,23.350,23.000,22.300,21.400,20.700,19.850,19.400,19.250,18.700,18.650,20.200,23.400,26.400,27.450,29.150,32.050,34.500,34.950,36.550,37.850,38.400,35.150,34.050,34.100,33.100,30.300,29.300,27.550,26.600,25.900,25.500,25.150,25.000,25.150,27.000,31.150,32.750,31.500,26.900,23.900,23.150,22.850,21.500,21.150,21.300,19.700,18.800,18.450,18.300,17.800,16.850,16.400,16.150,15.700,15.500,15.400,15.300,15.050,15.650,18.100,19.200,21.050,22.350,23.450,24.850,24.950,25.550,25.300,24.250,22.750,20.850,19.350,18.250,17.450,17.000,16.500,16.100,15.950,15.300,14.550,14.250,14.400,15.550,18.300,20.000,22.750,25.450,25.800,26.350,29.150,30.450,30.350,29.600,27.550,25.550,23.650,22.950,21.850,20.700,20.150,19.300,19.000,18.400,17.800,17.750,18.000,20.800,23.400,25.750,27.750,29.600,32.150,32.900,33.650,34.300,34.800,35.050,33.750,33.250,32.400,31.250,29.650,28.550,26.550,25.950,25.000,24.400,24.150,24.150,24.350,26.900,28.750,30.350,32.750,34.250,35.300,28.400,27.250,26.600,25.750,25.350,23.150,21.550,20.850,20.550,20.350,20.550,20.600,19.900,19.550,19.200,18.900,18.850,19.250,21.000,23.050,25.350,27.700,31.050,35.250,35.100,36.850,39.250,40.000,39.450,38.950,37.750,33.850,30.400,25.700,25.400,25.600,28.150,32.400,31.850,31.350,31.200,31.100,31.950,32.450,35.200,38.400,35.850,30.700,27.850,26.900,26.650,25.250,24.450,22.500,22.050,20.000,19.750,19.100,18.500,18.400,17.400,16.900,16.800,16.450,16.050,16.300,17.450,19.300,20.000,21.050,22.800,22.550,23.300,24.050,23.100,23.100,22.500,20.800,19.550,18.800,18.200,17.650,17.750,17.150,16.550,16.200,16.000,15.600,15.150,15.150,16.250,17.800,19.150,21.000,22.800,23.850,24.250,26.200,25.650,25.050,23.850,23.600,23.100,22.950,22.550,21.550,20.450,19.600,18.700,18.300,18.000,17.550,17.300,17.200,17.950,19.450,21.100,23.050,24.650,25.050,25.850,25.300,26.650,25.500,25.900,26.250,25.300,25.150,23.600,22.050,21.700,21.150,20.550,20.500,20.200,20.500,20.600,20.900,21.700,22.000,22.250,23.400,23.900,25.250,26.200,26.000,25.300,25.200,25.300,25.500,25.350,25.050,24.850,24.050,23.150,22.300,21.900,21.150,20.300,19.650,19.700,19.750,20.250,21.500,23.600,24.600,25.900,25.450,24.850,25.900,26.150,26.250,26.350,26.250,25.850,25.300,24.600,23.750,22.250,21.750,21.450,21.500,21.300,21.250,21.200,21.600,22.000,23.650,25.200,26.400,25.500,25.150,26.950,28.350,25.650,25.000,25.500,24.150,22.900,21.600,21.750,21.500,21.550,20.450,19.500,18.750,18.650,18.200,17.300,17.900,18.050,17.400,16.850,17.950,20.550,21.950,22.600,22.300,22.400,22.300,21.100,20.250,19.200,18.900,18.600,18.350,17.700,17.200,16.850,16.900,16.800,16.800,16.600,16.350,17.200,18.350,19.550,20.300,21.600,21.800,23.300,23.200,24.550,24.950,24.900,23.700,22.000,19.650,18.250,17.700,17.250,16.900,16.550,16.050,16.450,15.400,14.900,14.700,16.100,18.450,19.800,23.000,25.250,27.600,27.900,28.550,29.450,29.700,29.350,27.000,23.550,21.900,20.750,20.150,19.600,19.150,18.800,18.550,18.200,17.750,17.650,17.800,18.750,19.600,20.450,21.950,23.700,23.150,24.150,24.550,21.400,19.150,19.050,16.500,15.900,14.850,15.300,14.100,13.800,13.600,13.450,13.400,13.050,12.750,12.800,12.750,13.600,14.950,16.100,17.500,18.500,19.300,19.400,19.750,19.400,19.450,19.450,18.900,17.650,16.800,15.900,15.050,14.550,14.250,13.800,13.850,13.700,13.650,13.350,13.400,14.050,15.000,16.650,17.850,18.450,18.200,18.900,19.850,20.000,19.700,18.800,17.500,16.600,16.250,16.000,16.300,16.400,15.800,15.850,14.600,14.650,15.200,14.900,14.600,15.150,16.000,16.350,17.000,18.300,19.050,19.300,19.400,18.650,18.750,19.100,18.300,17.950,17.550,16.900,16.450,15.850,15.800,15.650,15.200,14.700,14.950,15.250,15.200,15.800,16.800,17.900,19.700,21.050,21.600,22.550,22.750,22.900,22.500,21.950,20.450,19.600,19.200,18.000,16.950,16.450,16.150,15.600,15.150,15.250,15.200,14.750,15.050,15.600,17.750,18.450,20.050,21.350,22.500,23.550,24.100,22.600,23.150,24.100,22.650,21.250,19.900,19.100,18.250,17.750,17.500,16.600,16.100,15.850,15.750,15.700,16.350,19.600,25.750,27.800,30.050,32.350,31.900,32.450,29.600,28.850,23.450,21.100,20.100,20.100,19.900,19.300,19.050,18.850".split(",")).astype(np.float32)
num_forecast_steps = 24 * 7 * 2 # Two weeks.
demand_training_data = demand[:-num_forecast_steps]
colors = sns.color_palette()
c1, c2 = colors[0], colors[1]
fig = plt.figure(figsize=(12, 6))
ax = fig.add_subplot(2, 1, 1)
ax.plot(demand_dates[:-num_forecast_steps],
demand[:-num_forecast_steps], lw=2, label="training data")
ax.set_ylabel("Hourly demand (GW)")
ax = fig.add_subplot(2, 1, 2)
ax.plot(demand_dates[:-num_forecast_steps],
temperature[:-num_forecast_steps], lw=2, label="training data", c=c2)
ax.set_ylabel("Temperature (deg C)")
ax.set_title("Temperature")
ax.xaxis.set_major_locator(demand_loc)
ax.xaxis.set_major_formatter(demand_fmt)
fig.suptitle("Electricity Demand in Victoria, Australia (2014)",
fontsize=15)
fig.autofmt_xdate()

### Model and fitting
Our model combines a hour-of-day and day-of-week seasonality, with a linear regression modeling the effect of temperature, and an autoregressive process to handle bounded-variance residuals.
def build_model(observed_time_series):
hour_of_day_effect = sts.Seasonal(
num_seasons=24,
observed_time_series=observed_time_series,
name='hour_of_day_effect')
day_of_week_effect = sts.Seasonal(
num_seasons=7, num_steps_per_season=24,
observed_time_series=observed_time_series,
name='day_of_week_effect')
temperature_effect = sts.LinearRegression(
design_matrix=jnp.reshape(temperature - jnp.mean(temperature),
(-1, 1)), name='temperature_effect')
autoregressive = sts.Autoregressive(
order=1,
observed_time_series=observed_time_series,
name='autoregressive')
model = sts.Sum([hour_of_day_effect,
day_of_week_effect,
temperature_effect,
autoregressive],
observed_time_series=observed_time_series)
return model
As above, we'll fit the model with variational inference and draw samples from the posterior.
demand_model = build_model(demand_training_data)
# Build the variational surrogate posteriors `qs`.
# variational_posteriors = tfp.sts.build_factored_surrogate_posterior(
# model=demand_model)
init_fn, build_surrogate_fn = (
tfp.sts.build_factored_surrogate_posterior_stateless(model=demand_model))
### Minimize the variational loss.
# Allow external control of optimization to reduce test runtimes.
num_variational_steps = 200 # @param { isTemplate: true}
num_variational_steps = int(num_variational_steps)
seed = tfp.random.sanitize_seed(jax.random.PRNGKey(42), salt='fit_stateless')
init_seed, fit_seed, sample_seed = tfp.random.split_seed(seed, n=3)
initial_parameters = init_fn(init_seed)
jd = demand_model.joint_distribution(demand_training_data)
# Build and optimize the variational loss function.
optimized_parameters, elbo_loss_curve = tfp.vi.fit_surrogate_posterior_stateless(
target_log_prob_fn=jd.log_prob,
initial_parameters=initial_parameters,
build_surrogate_posterior_fn=build_surrogate_fn,
optimizer=optax.adam(learning_rate=0.1),
num_steps=num_variational_steps,
seed=fit_seed)
plt.plot(elbo_loss_curve)
plt.show()
# Draw samples from the variational posterior.
surrogate_posterior = build_surrogate_fn(optimized_parameters)
q_samples_demand_ = surrogate_posterior.sample(50, seed=sample_seed)

print("Inferred parameters:")
for param in demand_model.parameters:
print("{}: {} +- {}".format(param.name,
jnp.mean(q_samples_demand_[param.name], axis=0),
jnp.std(q_samples_demand_[param.name], axis=0)))
```
Inferred parameters:
observation_noise_scale: 0.007361860014498234 +- 0.001575619913637638
hour_of_day_effect_drift_scale: 0.002189201768487692 +- 0.0007748314528726041
day_of_week_effect_drift_scale: 0.01211678609251976 +- 0.018613168969750404
temperature_effect_weights: [0.06205687] +- [0.00406887]
autoregressive_coefficients: [0.9839599] +- [0.00560341]
autoregressive_level_scale: 0.14477692544460297 +- 0.003696543164551258
```
### Forecasting and criticism
Again, we create a forecast simply by calling [`tfp.sts.forecast`](https://www.tensorflow.org/probability/api_docs/python/tfp/sts/forecast) with our model, time series, and sampled parameters.
demand_forecast_dist = tfp.sts.forecast(
model=demand_model,
observed_time_series=demand_training_data,
parameter_samples=q_samples_demand_,
num_steps_forecast=num_forecast_steps)
num_samples=10
demand_forecast_mean = demand_forecast_dist.mean()[..., 0]
demand_forecast_scale = demand_forecast_dist.stddev()[..., 0]
demand_forecast_samples =demand_forecast_dist.sample(
num_samples, seed=sample_seed)[..., 0]
fig, ax = plot_forecast(demand_dates, demand,
demand_forecast_mean,
demand_forecast_scale,
demand_forecast_samples,
title="Electricity demand forecast",
x_locator=demand_loc, x_formatter=demand_fmt)
ax.set_ylim([0, 10])
fig.tight_layout()

Let's visualize the decomposition of the observed and forecast series into the individual components:
# Get the distributions over component outputs from the posterior marginals on
# training data, and from the forecast model.
component_dists = sts.decompose_by_component(
demand_model,
observed_time_series=demand_training_data,
parameter_samples=q_samples_demand_)
forecast_component_dists = sts.decompose_forecast_by_component(
demand_model,
forecast_dist=demand_forecast_dist,
parameter_samples=q_samples_demand_)
demand_component_means_, demand_component_stddevs_ = (
{k.name: c.mean() for k, c in component_dists.items()},
{k.name: c.stddev() for k, c in component_dists.items()})
(
demand_forecast_component_means_,
demand_forecast_component_stddevs_
) = (
{k.name: c.mean() for k, c in forecast_component_dists.items()},
{k.name: c.stddev() for k, c in forecast_component_dists.items()}
)
# Concatenate the training data with forecasts for plotting.
component_with_forecast_means_ = collections.OrderedDict()
component_with_forecast_stddevs_ = collections.OrderedDict()
for k in demand_component_means_.keys():
component_with_forecast_means_[k] = jnp.concatenate([
demand_component_means_[k],
demand_forecast_component_means_[k]], axis=-1)
component_with_forecast_stddevs_[k] = jnp.concatenate([
demand_component_stddevs_[k],
demand_forecast_component_stddevs_[k]], axis=-1)
fig, axes = plot_components(
demand_dates,
component_with_forecast_means_,
component_with_forecast_stddevs_,
x_locator=demand_loc, x_formatter=demand_fmt)
for ax in axes.values():
ax.axvline(demand_dates[-num_forecast_steps], linestyle="--", color='red')

If we wanted to detect anomalies in the observed series, we might also be interested in the one-step predictive distributions: the forecast for each timestep, given only the timesteps up to that point. [`tfp.sts.one_step_predictive`](https://www.tensorflow.org/probability/api_docs/python/tfp/sts/one_step_predictive) computes all of the one-step predictive distributions in a single pass:
demand_one_step_dist = sts.one_step_predictive(
demand_model,
observed_time_series=demand,
parameter_samples=q_samples_demand_)
demand_one_step_mean, demand_one_step_scale = (
demand_one_step_dist.mean(), demand_one_step_dist.stddev())
A simple anomaly detection scheme is to flag all timesteps where the observations are more than three stddevs from the predicted value -- these are the most 'surprising' timesteps according to the model.
fig, ax = plot_one_step_predictive(
demand_dates, demand,
demand_one_step_mean, demand_one_step_scale,
x_locator=demand_loc, x_formatter=demand_fmt)
ax.set_ylim(0, 10)
# Use the one-step-ahead forecasts to detect anomalous timesteps.
zscores = jnp.abs((demand - demand_one_step_mean) /
demand_one_step_scale)
anomalies = zscores > 3.0
ax.scatter(demand_dates[anomalies],
demand[anomalies],
c="red", marker="x", s=20, linewidth=2, label=r"Anomalies (>3$\sigma$)")
ax.plot(demand_dates, zscores, color="black", alpha=0.1, label='predictive z-score')
ax.legend()
plt.show()
