
| | |  Xem trên GitHub Xem trên GitHub | |
Lý lịch
Sổ tay này trình bày cách tạo thẻ mô hình bằng Bộ công cụ thẻ mô hình với mô hình scikit-learning trong môi trường Jupyter / Colab. Bạn có thể tìm hiểu thêm về thẻ mô hình tại https://modelcards.withgoogle.com/about .
Thành lập
Đầu tiên chúng ta cần cài đặt và nhập các gói cần thiết.
Nâng cấp lên Pip 20.2 và cài đặt các gói
pip install -q --upgrade pip==20.2pip install -q -U seaborn scikit-learn model-card-toolkit
Bạn có khởi động lại thời gian chạy không?
Nếu bạn đang sử dụng Google Colab, lần đầu tiên bạn chạy ô ở trên, bạn phải khởi động lại thời gian chạy (Runtime> Restart runtime ...).
Nhập gói
Chúng tôi nhập các gói cần thiết, bao gồm cả scikit-learning.
from datetime import date
from io import BytesIO
from IPython import display
from model_card_toolkit import ModelCardToolkit
from sklearn.datasets import load_breast_cancer
from sklearn.ensemble import GradientBoostingClassifier
from sklearn.model_selection import train_test_split
from sklearn.metrics import plot_roc_curve, plot_confusion_matrix

import base64
import matplotlib.pyplot as plt
import pandas as pd
import seaborn as sns
import uuid
Tải dữ liệu
Ví dụ này sử dụng Breast Cancer Wisconsin Chẩn đoán bộ dữ liệu mà scikit-học có thể tải bằng cách sử dụng load_breast_cancer) ( chức năng.
cancer = load_breast_cancer()

X = pd.DataFrame(cancer.data, columns=cancer.feature_names)
y = pd.Series(cancer.target)

X_train, X_test, y_train, y_test = train_test_split(X, y)
X_train.head()
y_train.head()
28     0
157    1
381    1
436    1
71     1
dtype: int64
Dữ liệu lô đất
Chúng tôi sẽ tạo một số ô từ dữ liệu mà chúng tôi sẽ đưa vào thẻ mô hình.
# Utility function that will export a plot to a base-64 encoded string that the model card will accept.

def plot_to_str():
    img = BytesIO()
    plt.savefig(img, format='png')
    return base64.encodebytes(img.getvalue()).decode('utf-8')
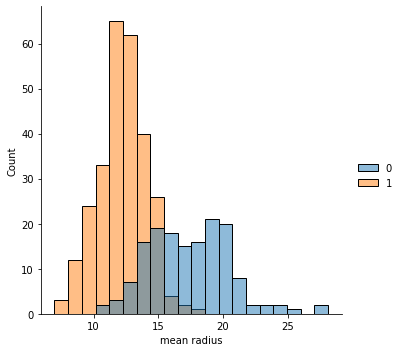
# Plot the mean radius feature for both the train and test sets
sns.displot(x=X_train['mean radius'], hue=y_train)
mean_radius_train = plot_to_str()
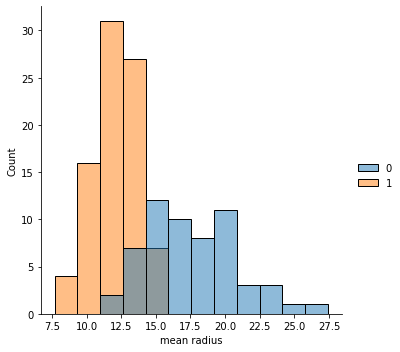
sns.displot(x=X_test['mean radius'], hue=y_test)
mean_radius_test = plot_to_str()
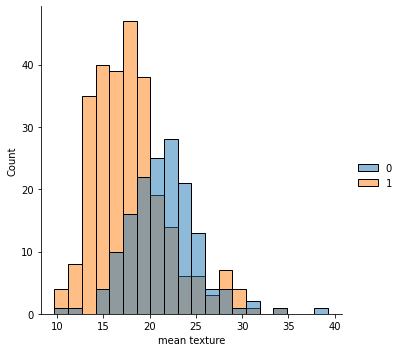
# Plot the mean texture feature for both the train and test sets
sns.displot(x=X_train['mean texture'], hue=y_train)
mean_texture_train = plot_to_str()
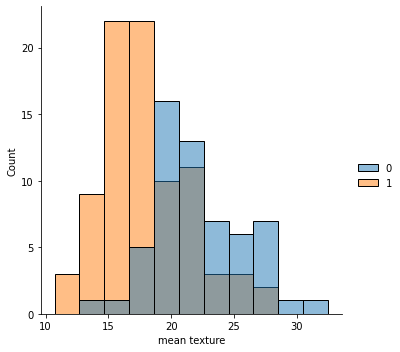
sns.displot(x=X_test['mean texture'], hue=y_test)
mean_texture_test = plot_to_str()
Mô hình tàu hỏa
# Create a classifier and fit the training data

clf = GradientBoostingClassifier().fit(X_train, y_train)
Đánh giá mô hình
# Plot a ROC curve

plot_roc_curve(clf, X_test, y_test)
roc_curve = plot_to_str()

# Plot a confusion matrix

plot_confusion_matrix(clf, X_test, y_test)
confusion_matrix = plot_to_str()

Tạo thẻ mô hình
Khởi tạo bộ công cụ và thẻ mô hình
mct = ModelCardToolkit()

model_card = mct.scaffold_assets()
Chú thích thông tin vào thẻ mô hình
model_card.model_details.name = 'Breast Cancer Wisconsin (Diagnostic) Dataset'
model_card.model_details.overview = (
    'This model predicts whether breast cancer is benign or malignant based on '
    'image measurements.')
model_card.model_details.owners = [
    {'name': 'Model Cards Team', 'contact': 'model-cards@google.com'}
]
model_card.model_details.references = [
    'https://archive.ics.uci.edu/ml/datasets/Breast+Cancer+Wisconsin+(Diagnostic)',
    'https://minds.wisconsin.edu/bitstream/handle/1793/59692/TR1131.pdf'
]
model_card.model_details.version.name = str(uuid.uuid4())
model_card.model_details.version.date = str(date.today())

model_card.considerations.ethical_considerations = [{
    'name': ('Manual selection of image sections to digitize could create '
            'selection bias'),
    'mitigation_strategy': 'Automate the selection process'
}]
model_card.considerations.limitations = ['Breast cancer diagnosis']
model_card.considerations.use_cases = ['Breast cancer diagnosis']
model_card.considerations.users = ['Medical professionals', 'ML researchers']


model_card.model_parameters.data.train.graphics.description = (
  f'{len(X_train)} rows with {len(X_train.columns)} features')
model_card.model_parameters.data.train.graphics.collection = [
    {'image': mean_radius_train},
    {'image': mean_texture_train}
]
model_card.model_parameters.data.eval.graphics.description = (
  f'{len(X_test)} rows with {len(X_test.columns)} features')
model_card.model_parameters.data.eval.graphics.collection = [
    {'image': mean_radius_test},
    {'image': mean_texture_test}
]
model_card.quantitative_analysis.graphics.description = (
  'ROC curve and confusion matrix')
model_card.quantitative_analysis.graphics.collection = [
    {'image': roc_curve},
    {'image': confusion_matrix}
]

mct.update_model_card_json(model_card)
Tạo thẻ mô hình
# Return the model card document as an HTML page

html = mct.export_format()

display.display(display.HTML(html))