
| | |  गिटहब पर देखें गिटहब पर देखें | |
पृष्ठभूमि
यह नोटबुक दर्शाती है कि जुपिटर/कोलाब वातावरण में स्किकिट-लर्न मॉडल के साथ मॉडल कार्ड टूलकिट का उपयोग करके एक मॉडल कार्ड कैसे बनाया जाता है। आपको कम से मॉडल कार्ड के बारे में अधिक सीख सकते हैं https://modelcards.withgoogle.com/about ।
सेट अप
हमें पहले आवश्यक पैकेजों को स्थापित और आयात करने की आवश्यकता है।
पिप 20.2 में अपग्रेड करें और पैकेज स्थापित करें
pip install -q --upgrade pip==20.2pip install -q -U seaborn scikit-learn model-card-toolkit
क्या आपने रनटाइम को पुनरारंभ किया?
यदि आप Google Colab का उपयोग कर रहे हैं, जब आप पहली बार ऊपर सेल चलाते हैं, तो आपको रनटाइम को पुनरारंभ करना होगा (रनटाइम> रनटाइम पुनरारंभ करें ...)।
पैकेज आयात करें
हम स्किकिट-लर्न सहित आवश्यक पैकेज आयात करते हैं।
from datetime import date
from io import BytesIO
from IPython import display
from model_card_toolkit import ModelCardToolkit
from sklearn.datasets import load_breast_cancer
from sklearn.ensemble import GradientBoostingClassifier
from sklearn.model_selection import train_test_split
from sklearn.metrics import plot_roc_curve, plot_confusion_matrix

import base64
import matplotlib.pyplot as plt
import pandas as pd
import seaborn as sns
import uuid
लोड डेटा
इस उदाहरण स्तन कैंसर विस्कॉन्सिन निदान डाटासेट कि scikit-जानने का उपयोग कर लोड कर सकते हैं का उपयोग करता है load_breast_cancer () समारोह।
cancer = load_breast_cancer()

X = pd.DataFrame(cancer.data, columns=cancer.feature_names)
y = pd.Series(cancer.target)

X_train, X_test, y_train, y_test = train_test_split(X, y)
X_train.head()
y_train.head()
28     0
157    1
381    1
436    1
71     1
dtype: int64
प्लॉट डेटा
हम डेटा से कई प्लॉट बनाएंगे जिन्हें हम मॉडल कार्ड में शामिल करेंगे।
# Utility function that will export a plot to a base-64 encoded string that the model card will accept.

def plot_to_str():
    img = BytesIO()
    plt.savefig(img, format='png')
    return base64.encodebytes(img.getvalue()).decode('utf-8')
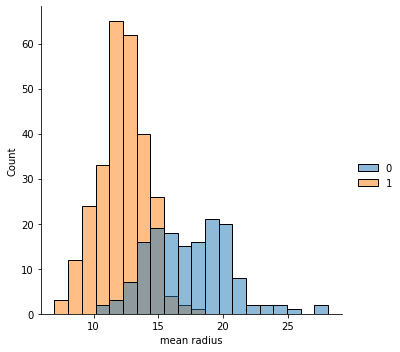
# Plot the mean radius feature for both the train and test sets
sns.displot(x=X_train['mean radius'], hue=y_train)
mean_radius_train = plot_to_str()
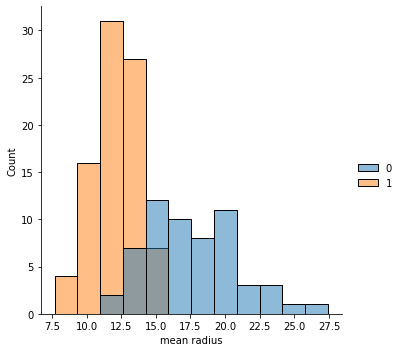
sns.displot(x=X_test['mean radius'], hue=y_test)
mean_radius_test = plot_to_str()
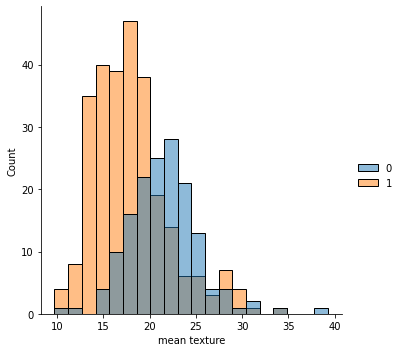
# Plot the mean texture feature for both the train and test sets
sns.displot(x=X_train['mean texture'], hue=y_train)
mean_texture_train = plot_to_str()
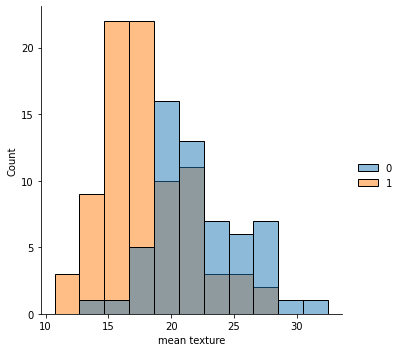
sns.displot(x=X_test['mean texture'], hue=y_test)
mean_texture_test = plot_to_str()
ट्रेन मॉडल
# Create a classifier and fit the training data

clf = GradientBoostingClassifier().fit(X_train, y_train)
मॉडल का मूल्यांकन करें
# Plot a ROC curve

plot_roc_curve(clf, X_test, y_test)
roc_curve = plot_to_str()

# Plot a confusion matrix

plot_confusion_matrix(clf, X_test, y_test)
confusion_matrix = plot_to_str()

एक मॉडल कार्ड बनाएं
टूलकिट और मॉडल कार्ड प्रारंभ करें
mct = ModelCardToolkit()

model_card = mct.scaffold_assets()
मॉडल कार्ड में जानकारी एनोटेट करें
model_card.model_details.name = 'Breast Cancer Wisconsin (Diagnostic) Dataset'
model_card.model_details.overview = (
    'This model predicts whether breast cancer is benign or malignant based on '
    'image measurements.')
model_card.model_details.owners = [
    {'name': 'Model Cards Team', 'contact': 'model-cards@google.com'}
]
model_card.model_details.references = [
    'https://archive.ics.uci.edu/ml/datasets/Breast+Cancer+Wisconsin+(Diagnostic)',
    'https://minds.wisconsin.edu/bitstream/handle/1793/59692/TR1131.pdf'
]
model_card.model_details.version.name = str(uuid.uuid4())
model_card.model_details.version.date = str(date.today())

model_card.considerations.ethical_considerations = [{
    'name': ('Manual selection of image sections to digitize could create '
            'selection bias'),
    'mitigation_strategy': 'Automate the selection process'
}]
model_card.considerations.limitations = ['Breast cancer diagnosis']
model_card.considerations.use_cases = ['Breast cancer diagnosis']
model_card.considerations.users = ['Medical professionals', 'ML researchers']


model_card.model_parameters.data.train.graphics.description = (
  f'{len(X_train)} rows with {len(X_train.columns)} features')
model_card.model_parameters.data.train.graphics.collection = [
    {'image': mean_radius_train},
    {'image': mean_texture_train}
]
model_card.model_parameters.data.eval.graphics.description = (
  f'{len(X_test)} rows with {len(X_test.columns)} features')
model_card.model_parameters.data.eval.graphics.collection = [
    {'image': mean_radius_test},
    {'image': mean_texture_test}
]
model_card.quantitative_analysis.graphics.description = (
  'ROC curve and confusion matrix')
model_card.quantitative_analysis.graphics.collection = [
    {'image': roc_curve},
    {'image': confusion_matrix}
]

mct.update_model_card_json(model_card)
मॉडल कार्ड जनरेट करें
# Return the model card document as an HTML page

html = mct.export_format()

display.display(display.HTML(html))