
An Example of a Key Component of TensorFlow Extended
 View source on GitHub
This example colab notebook illustrates how TensorFlow Data Validation (TFDV) can be used to investigate and visualize your dataset. That includes looking at descriptive statistics, inferring a schema, checking for and fixing anomalies, and checking for drift and skew in our dataset. It's important to understand your dataset's characteristics, including how it might change over time in your production pipeline. It's also important to look for anomalies in your data, and to compare your training, evaluation, and serving datasets to make sure that they're consistent.
We'll use data from the Taxi Trips dataset released by the City of Chicago.
Read more about the dataset in Google BigQuery. Explore the full dataset in the BigQuery UI.
The columns in the dataset are:
| pickup_community_area | fare | trip_start_month |
| trip_start_hour | trip_start_day | trip_start_timestamp |
| pickup_latitude | pickup_longitude | dropoff_latitude |
| dropoff_longitude | trip_miles | pickup_census_tract |
| dropoff_census_tract | payment_type | company |
| trip_seconds | dropoff_community_area | tips |
Install and import packages
Install the packages for TensorFlow Data Validation.
Upgrade Pip
To avoid upgrading Pip in a system when running locally, check to make sure that we're running in Colab. Local systems can of course be upgraded separately.
try:
  import colab
  !pip install --upgrade pip
except:
  pass
Install Data Validation packages
Install the TensorFlow Data Validation packages and dependencies, which takes a few minutes. You may see warnings and errors regarding incompatible dependency versions, which you will resolve in the next section.
print('Installing TensorFlow Data Validation')
!pip install --upgrade 'tensorflow_data_validation[visualization]<2'
Import TensorFlow and reload updated packages
The prior step updates the default packages in the Gooogle Colab environment, so you must reload the package resources to resolve the new dependencies.
import pkg_resources
import importlib
importlib.reload(pkg_resources)
<module 'pkg_resources' from '/tmpfs/src/tf_docs_env/lib/python3.9/site-packages/pkg_resources/__init__.py'>
Check the versions of TensorFlow and the Data Validation before proceeding.
import tensorflow as tf
import tensorflow_data_validation as tfdv
print('TF version:', tf.__version__)
print('TFDV version:', tfdv.version.__version__)
TF version: 2.12.1
TFDV version: 1.13.0
Load the dataset
We will download our dataset from Google Cloud Storage.
import os
import tempfile, urllib, zipfile

# Set up some globals for our file paths
BASE_DIR = tempfile.mkdtemp()
DATA_DIR = os.path.join(BASE_DIR, 'data')
OUTPUT_DIR = os.path.join(BASE_DIR, 'chicago_taxi_output')
TRAIN_DATA = os.path.join(DATA_DIR, 'train', 'data.csv')
EVAL_DATA = os.path.join(DATA_DIR, 'eval', 'data.csv')
SERVING_DATA = os.path.join(DATA_DIR, 'serving', 'data.csv')

# Download the zip file from GCP and unzip it
zip, headers = urllib.request.urlretrieve('https://storage.googleapis.com/artifacts.tfx-oss-public.appspot.com/datasets/chicago_data.zip')
zipfile.ZipFile(zip).extractall(BASE_DIR)
zipfile.ZipFile(zip).close()

print("Here's what we downloaded:")
!ls -R {os.path.join(BASE_DIR, 'data')}
Here's what we downloaded:
/tmpfs/tmp/tmpsjp7pkfy/data:
eval  serving  train

/tmpfs/tmp/tmpsjp7pkfy/data/eval:
data.csv

/tmpfs/tmp/tmpsjp7pkfy/data/serving:
data.csv

/tmpfs/tmp/tmpsjp7pkfy/data/train:
data.csv
Compute and visualize statistics
First we'll use tfdv.generate_statistics_from_csv to compute statistics for our training data. (ignore the snappy warnings)
TFDV can compute descriptive statistics that provide a quick overview of the data in terms of the features that are present and the shapes of their value distributions.
Internally, TFDV uses Apache Beam's data-parallel processing framework to scale the computation of statistics over large datasets. For applications that wish to integrate deeper with TFDV (e.g., attach statistics generation at the end of a data-generation pipeline), the API also exposes a Beam PTransform for statistics generation.
train_stats = tfdv.generate_statistics_from_csv(data_location=TRAIN_DATA)
WARNING:apache_beam.runners.interactive.interactive_environment:Dependencies required for Interactive Beam PCollection visualization are not available, please use: `pip install apache-beam[interactive]` to install necessary dependencies to enable all data visualization features.
WARNING:apache_beam.io.tfrecordio:Couldn't find python-snappy so the implementation of _TFRecordUtil._masked_crc32c is not as fast as it could be.
WARNING:tensorflow:From /tmpfs/src/tf_docs_env/lib/python3.9/site-packages/tensorflow_data_validation/utils/artifacts_io_impl.py:93: tf_record_iterator (from tensorflow.python.lib.io.tf_record) is deprecated and will be removed in a future version.
Instructions for updating:
Use eager execution and:
`tf.data.TFRecordDataset(path)`
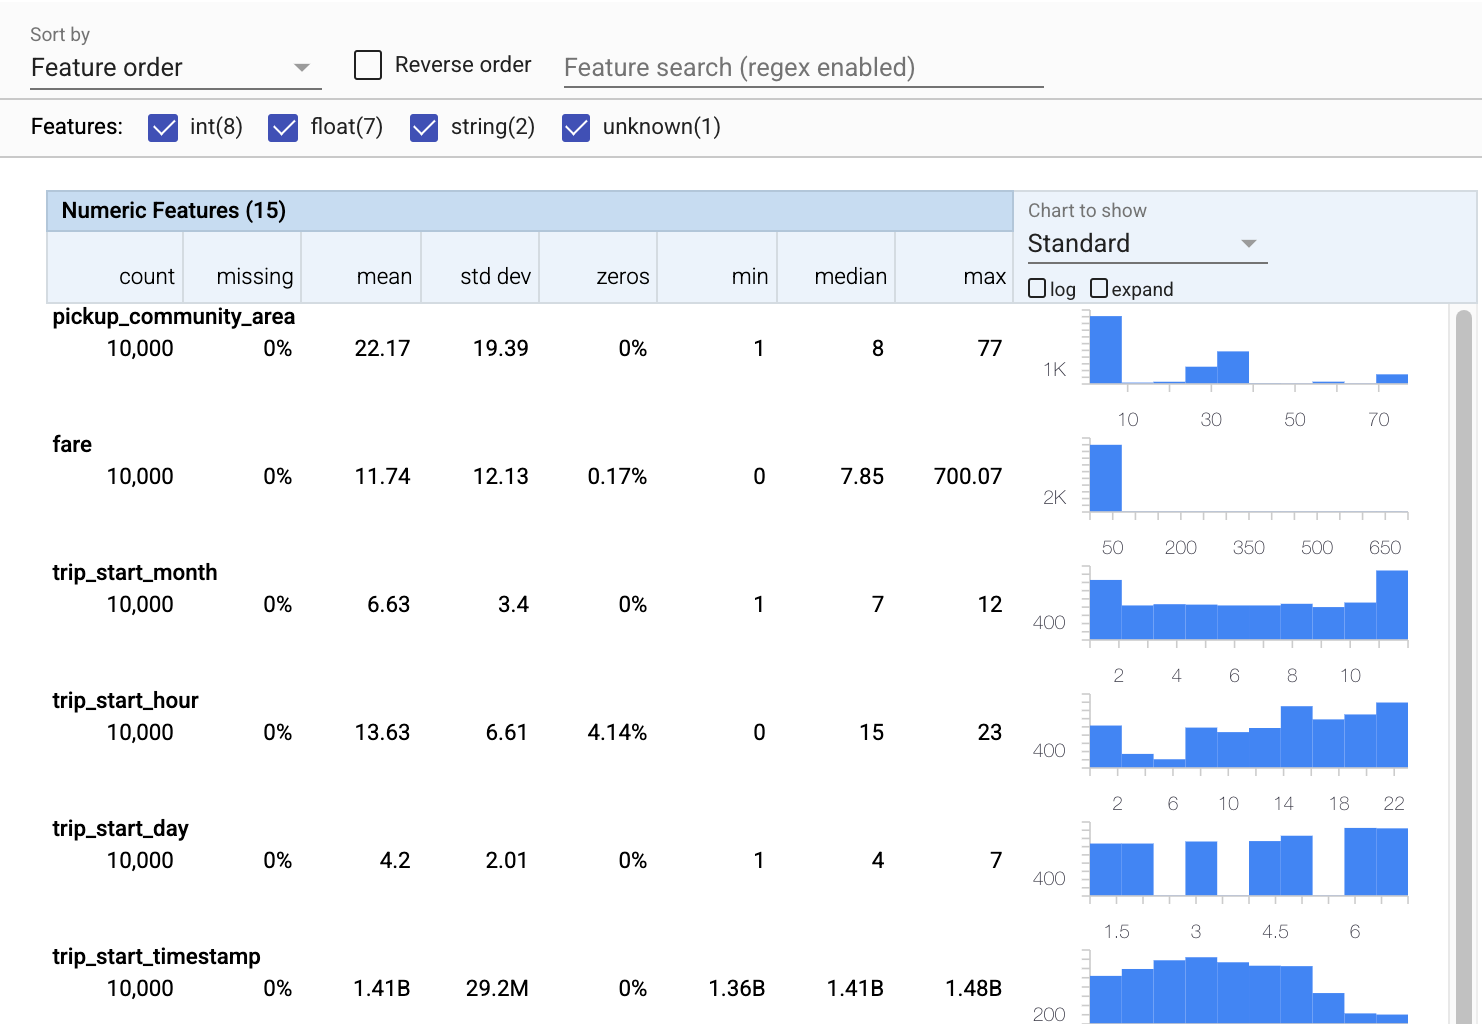
Now let's use tfdv.visualize_statistics, which uses Facets to create a succinct visualization of our training data:
- Notice that numeric features and catagorical features are visualized separately, and that charts are displayed showing the distributions for each feature.
- Notice that features with missing or zero values display a percentage in red as a visual indicator that there may be issues with examples in those features. The percentage is the percentage of examples that have missing or zero values for that feature.
- Notice that there are no examples with values for
pickup_census_tract. This is an opportunity for dimensionality reduction! - Try clicking "expand" above the charts to change the display
- Try hovering over bars in the charts to display bucket ranges and counts
- Try switching between the log and linear scales, and notice how the log scale reveals much more detail about the
payment_typecategorical feature - Try selecting "quantiles" from the "Chart to show" menu, and hover over the markers to show the quantile percentages
# docs-infra: no-execute
tfdv.visualize_statistics(train_stats)
Infer a schema
Now let's use tfdv.infer_schema to create a schema for our data. A schema defines constraints for the data that are relevant for ML. Example constraints include the data type of each feature, whether it's numerical or categorical, or the frequency of its presence in the data. For categorical features the schema also defines the domain - the list of acceptable values. Since writing a schema can be a tedious task, especially for datasets with lots of features, TFDV provides a method to generate an initial version of the schema based on the descriptive statistics.
Getting the schema right is important because the rest of our production pipeline will be relying on the schema that TFDV generates to be correct. The schema also provides documentation for the data, and so is useful when different developers work on the same data. Let's use tfdv.display_schema to display the inferred schema so that we can review it.
schema = tfdv.infer_schema(statistics=train_stats)
tfdv.display_schema(schema=schema)
Check evaluation data for errors
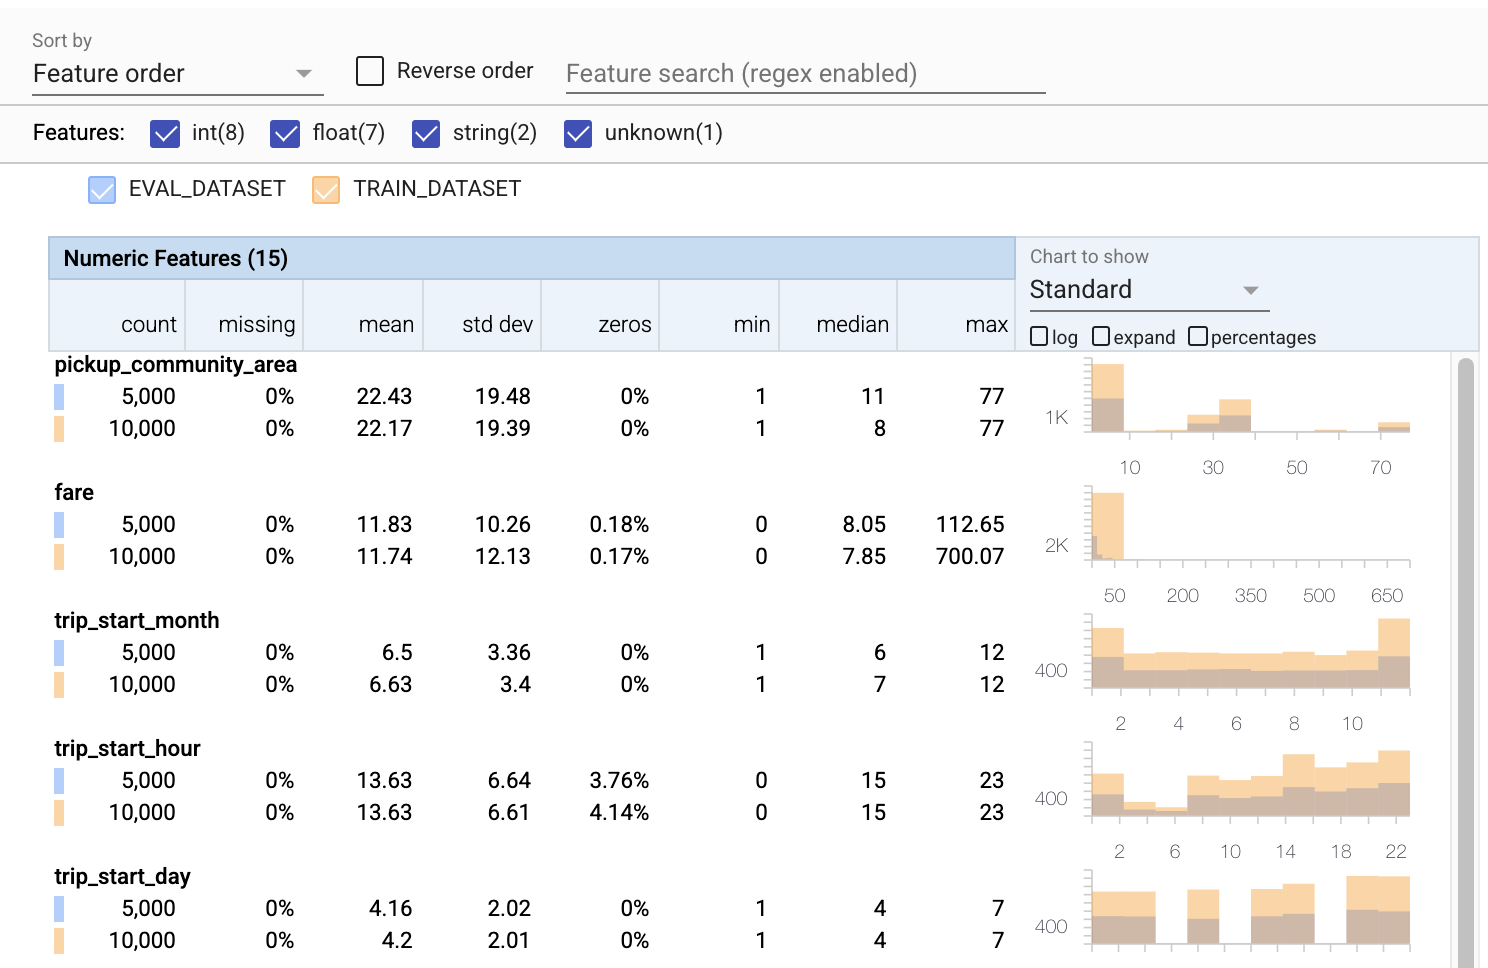
So far we've only been looking at the training data. It's important that our evaluation data is consistent with our training data, including that it uses the same schema. It's also important that the evaluation data includes examples of roughly the same ranges of values for our numerical features as our training data, so that our coverage of the loss surface during evaluation is roughly the same as during training. The same is true for categorical features. Otherwise, we may have training issues that are not identified during evaluation, because we didn't evaluate part of our loss surface.
- Notice that each feature now includes statistics for both the training and evaluation datasets.
- Notice that the charts now have both the training and evaluation datasets overlaid, making it easy to compare them.
- Notice that the charts now include a percentages view, which can be combined with log or the default linear scales.
- Notice that the mean and median for
trip_milesare different for the training versus the evaluation datasets. Will that cause problems? - Wow, the max
tipsis very different for the training versus the evaluation datasets. Will that cause problems? - Click expand on the Numeric Features chart, and select the log scale. Review the
trip_secondsfeature, and notice the difference in the max. Will evaluation miss parts of the loss surface?
# Compute stats for evaluation data
eval_stats = tfdv.generate_statistics_from_csv(data_location=EVAL_DATA)
# docs-infra: no-execute
# Compare evaluation data with training data
tfdv.visualize_statistics(lhs_statistics=eval_stats, rhs_statistics=train_stats,
                          lhs_name='EVAL_DATASET', rhs_name='TRAIN_DATASET')
Check for evaluation anomalies
Does our evaluation dataset match the schema from our training dataset? This is especially important for categorical features, where we want to identify the range of acceptable values.
# Check eval data for errors by validating the eval data stats using the previously inferred schema.
anomalies = tfdv.validate_statistics(statistics=eval_stats, schema=schema)
tfdv.display_anomalies(anomalies)
Fix evaluation anomalies in the schema
Oops! It looks like we have some new values for company in our evaluation data, that we didn't have in our training data. We also have a new value for payment_type. These should be considered anomalies, but what we decide to do about them depends on our domain knowledge of the data. If an anomaly truly indicates a data error, then the underlying data should be fixed. Otherwise, we can simply update the schema to include the values in the eval dataset.
Unless we change our evaluation dataset we can't fix everything, but we can fix things in the schema that we're comfortable accepting. That includes relaxing our view of what is and what is not an anomaly for particular features, as well as updating our schema to include missing values for categorical features. TFDV has enabled us to discover what we need to fix.
Let's make those fixes now, and then review one more time.
# Relax the minimum fraction of values that must come from the domain for feature company.
company = tfdv.get_feature(schema, 'company')
company.distribution_constraints.min_domain_mass = 0.9

# Add new value to the domain of feature payment_type.
payment_type_domain = tfdv.get_domain(schema, 'payment_type')
payment_type_domain.value.append('Prcard')

# Validate eval stats after updating the schema
updated_anomalies = tfdv.validate_statistics(eval_stats, schema)
tfdv.display_anomalies(updated_anomalies)
Hey, look at that! We verified that the training and evaluation data are now consistent! Thanks TFDV ;)
Schema Environments
We also split off a 'serving' dataset for this example, so we should check that too. By default all datasets in a pipeline should use the same schema, but there are often exceptions. For example, in supervised learning we need to include labels in our dataset, but when we serve the model for inference the labels will not be included. In some cases introducing slight schema variations is necessary.
Environments can be used to express such requirements. In particular, features in schema can be associated with a set of environments using default_environment, in_environment and not_in_environment.
For example, in this dataset the tips feature is included as the label for training, but it's missing in the serving data. Without environment specified, it will show up as an anomaly.
serving_stats = tfdv.generate_statistics_from_csv(SERVING_DATA)
serving_anomalies = tfdv.validate_statistics(serving_stats, schema)

tfdv.display_anomalies(serving_anomalies)
We'll deal with the tips feature below. We also have an INT value in our trip seconds, where our schema expected a FLOAT. By making us aware of that difference, TFDV helps uncover inconsistencies in the way the data is generated for training and serving. It's very easy to be unaware of problems like that until model performance suffers, sometimes catastrophically. It may or may not be a significant issue, but in any case this should be cause for further investigation.
In this case, we can safely convert INT values to FLOATs, so we want to tell TFDV to use our schema to infer the type. Let's do that now.
options = tfdv.StatsOptions(schema=schema, infer_type_from_schema=True)
serving_stats = tfdv.generate_statistics_from_csv(SERVING_DATA, stats_options=options)
serving_anomalies = tfdv.validate_statistics(serving_stats, schema)

tfdv.display_anomalies(serving_anomalies)
Now we just have the tips feature (which is our label) showing up as an anomaly ('Column dropped'). Of course we don't expect to have labels in our serving data, so let's tell TFDV to ignore that.
# All features are by default in both TRAINING and SERVING environments.
schema.default_environment.append('TRAINING')
schema.default_environment.append('SERVING')

# Specify that 'tips' feature is not in SERVING environment.
tfdv.get_feature(schema, 'tips').not_in_environment.append('SERVING')

serving_anomalies_with_env = tfdv.validate_statistics(
    serving_stats, schema, environment='SERVING')

tfdv.display_anomalies(serving_anomalies_with_env)
Check for drift and skew
In addition to checking whether a dataset conforms to the expectations set in the schema, TFDV also provides functionalities to detect drift and skew. TFDV performs this check by comparing the statistics of the different datasets based on the drift/skew comparators specified in the schema.
Drift
Drift detection is supported for categorical features and between consecutive spans of data (i.e., between span N and span N+1), such as between different days of training data. We express drift in terms of L-infinity distance, and you can set the threshold distance so that you receive warnings when the drift is higher than is acceptable. Setting the correct distance is typically an iterative process requiring domain knowledge and experimentation.
Skew
TFDV can detect three different kinds of skew in your data - schema skew, feature skew, and distribution skew.
Schema Skew
Schema skew occurs when the training and serving data do not conform to the same schema. Both training and serving data are expected to adhere to the same schema. Any expected deviations between the two (such as the label feature being only present in the training data but not in serving) should be specified through environments field in the schema.
Feature Skew
Feature skew occurs when the feature values that a model trains on are different from the feature values that it sees at serving time. For example, this can happen when:
- A data source that provides some feature values is modified between training and serving time
- There is different logic for generating features between training and serving. For example, if you apply some transformation only in one of the two code paths.
Distribution Skew
Distribution skew occurs when the distribution of the training dataset is significantly different from the distribution of the serving dataset. One of the key causes for distribution skew is using different code or different data sources to generate the training dataset. Another reason is a faulty sampling mechanism that chooses a non-representative subsample of the serving data to train on.
# Add skew comparator for 'payment_type' feature.
payment_type = tfdv.get_feature(schema, 'payment_type')
payment_type.skew_comparator.infinity_norm.threshold = 0.01

# Add drift comparator for 'company' feature.
company=tfdv.get_feature(schema, 'company')
company.drift_comparator.infinity_norm.threshold = 0.001

skew_anomalies = tfdv.validate_statistics(train_stats, schema,
                                          previous_statistics=eval_stats,
                                          serving_statistics=serving_stats)

tfdv.display_anomalies(skew_anomalies)
In this example we do see some drift, but it is well below the threshold that we've set.
Freeze the schema
Now that the schema has been reviewed and curated, we will store it in a file to reflect its "frozen" state.
from tensorflow.python.lib.io import file_io
from google.protobuf import text_format

file_io.recursive_create_dir(OUTPUT_DIR)
schema_file = os.path.join(OUTPUT_DIR, 'schema.pbtxt')
tfdv.write_schema_text(schema, schema_file)

!cat {schema_file}
feature {
  name: "pickup_community_area"
  type: INT
  presence {
    min_fraction: 1.0
    min_count: 1
  }
  shape {
    dim {
      size: 1
    }
  }
}
feature {
  name: "fare"
  type: FLOAT
  presence {
    min_fraction: 1.0
    min_count: 1
  }
  shape {
    dim {
      size: 1
    }
  }
}
feature {
  name: "trip_start_month"
  type: INT
  presence {
    min_fraction: 1.0
    min_count: 1
  }
  shape {
    dim {
      size: 1
    }
  }
}
feature {
  name: "trip_start_hour"
  type: INT
  presence {
    min_fraction: 1.0
    min_count: 1
  }
  shape {
    dim {
      size: 1
    }
  }
}
feature {
  name: "trip_start_day"
  type: INT
  presence {
    min_fraction: 1.0
    min_count: 1
  }
  shape {
    dim {
      size: 1
    }
  }
}
feature {
  name: "trip_start_timestamp"
  type: INT
  presence {
    min_fraction: 1.0
    min_count: 1
  }
  shape {
    dim {
      size: 1
    }
  }
}
feature {
  name: "pickup_latitude"
  type: FLOAT
  presence {
    min_fraction: 1.0
    min_count: 1
  }
  shape {
    dim {
      size: 1
    }
  }
}
feature {
  name: "pickup_longitude"
  type: FLOAT
  presence {
    min_fraction: 1.0
    min_count: 1
  }
  shape {
    dim {
      size: 1
    }
  }
}
feature {
  name: "dropoff_latitude"
  value_count {
    min: 1
    max: 1
  }
  type: FLOAT
  presence {
    min_count: 1
  }
}
feature {
  name: "dropoff_longitude"
  value_count {
    min: 1
    max: 1
  }
  type: FLOAT
  presence {
    min_count: 1
  }
}
feature {
  name: "trip_miles"
  type: FLOAT
  presence {
    min_fraction: 1.0
    min_count: 1
  }
  shape {
    dim {
      size: 1
    }
  }
}
feature {
  name: "pickup_census_tract"
  type: BYTES
  presence {
    min_count: 0
  }
}
feature {
  name: "dropoff_census_tract"
  value_count {
    min: 1
    max: 1
  }
  type: INT
  presence {
    min_count: 1
  }
}
feature {
  name: "payment_type"
  type: BYTES
  domain: "payment_type"
  presence {
    min_fraction: 1.0
    min_count: 1
  }
  skew_comparator {
    infinity_norm {
      threshold: 0.01
    }
  }
  shape {
    dim {
      size: 1
    }
  }
}
feature {
  name: "company"
  value_count {
    min: 1
    max: 1
  }
  type: BYTES
  domain: "company"
  presence {
    min_count: 1
  }
  distribution_constraints {
    min_domain_mass: 0.9
  }
  drift_comparator {
    infinity_norm {
      threshold: 0.001
    }
  }
}
feature {
  name: "trip_seconds"
  type: INT
  presence {
    min_fraction: 1.0
    min_count: 1
  }
  shape {
    dim {
      size: 1
    }
  }
}
feature {
  name: "dropoff_community_area"
  value_count {
    min: 1
    max: 1
  }
  type: INT
  presence {
    min_count: 1
  }
}
feature {
  name: "tips"
  type: FLOAT
  presence {
    min_fraction: 1.0
    min_count: 1
  }
  not_in_environment: "SERVING"
  shape {
    dim {
      size: 1
    }
  }
}
string_domain {
  name: "payment_type"
  value: "Cash"
  value: "Credit Card"
  value: "Dispute"
  value: "No Charge"
  value: "Pcard"
  value: "Unknown"
  value: "Prcard"
}
string_domain {
  name: "company"
  value: "0118 - 42111 Godfrey S.Awir"
  value: "0694 - 59280 Chinesco Trans Inc"
  value: "1085 - 72312 N and W Cab Co"
  value: "2733 - 74600 Benny Jona"
  value: "2809 - 95474 C & D Cab Co Inc."
  value: "3011 - 66308 JBL Cab Inc."
  value: "3152 - 97284 Crystal Abernathy"
  value: "3201 - C&D Cab Co Inc"
  value: "3201 - CID Cab Co Inc"
  value: "3253 - 91138 Gaither Cab Co."
  value: "3385 - 23210 Eman Cab"
  value: "3623 - 72222 Arrington Enterprises"
  value: "3897 - Ilie Malec"
  value: "4053 - Adwar H. Nikola"
  value: "4197 - 41842 Royal Star"
  value: "4615 - 83503 Tyrone Henderson"
  value: "4615 - Tyrone Henderson"
  value: "4623 - Jay Kim"
  value: "5006 - 39261 Salifu Bawa"
  value: "5006 - Salifu Bawa"
  value: "5074 - 54002 Ahzmi Inc"
  value: "5074 - Ahzmi Inc"
  value: "5129 - 87128"
  value: "5129 - 98755 Mengisti Taxi"
  value: "5129 - Mengisti Taxi"
  value: "5724 - KYVI Cab Inc"
  value: "585 - Valley Cab Co"
  value: "5864 - 73614 Thomas Owusu"
  value: "5864 - Thomas Owusu"
  value: "5874 - 73628 Sergey Cab Corp."
  value: "5997 - 65283 AW Services Inc."
  value: "5997 - AW Services Inc."
  value: "6488 - 83287 Zuha Taxi"
  value: "6743 - Luhak Corp"
  value: "Blue Ribbon Taxi Association Inc."
  value: "C & D Cab Co Inc"
  value: "Chicago Elite Cab Corp."
  value: "Chicago Elite Cab Corp. (Chicago Carriag"
  value: "Chicago Medallion Leasing INC"
  value: "Chicago Medallion Management"
  value: "Choice Taxi Association"
  value: "Dispatch Taxi Affiliation"
  value: "KOAM Taxi Association"
  value: "Northwest Management LLC"
  value: "Taxi Affiliation Services"
  value: "Top Cab Affiliation"
}
default_environment: "TRAINING"
default_environment: "SERVING"
When to use TFDV
It's easy to think of TFDV as only applying to the start of your training pipeline, as we did here, but in fact it has many uses. Here's a few more:
- Validating new data for inference to make sure that we haven't suddenly started receiving bad features
- Validating new data for inference to make sure that our model has trained on that part of the decision surface
- Validating our data after we've transformed it and done feature engineering (probably using TensorFlow Transform) to make sure we haven't done something wrong