Learn the latest in machine learning, generative AI, and more at WiML Symposium 2023
Register
透過集合功能整理內容
你可以依據偏好儲存及分類內容。
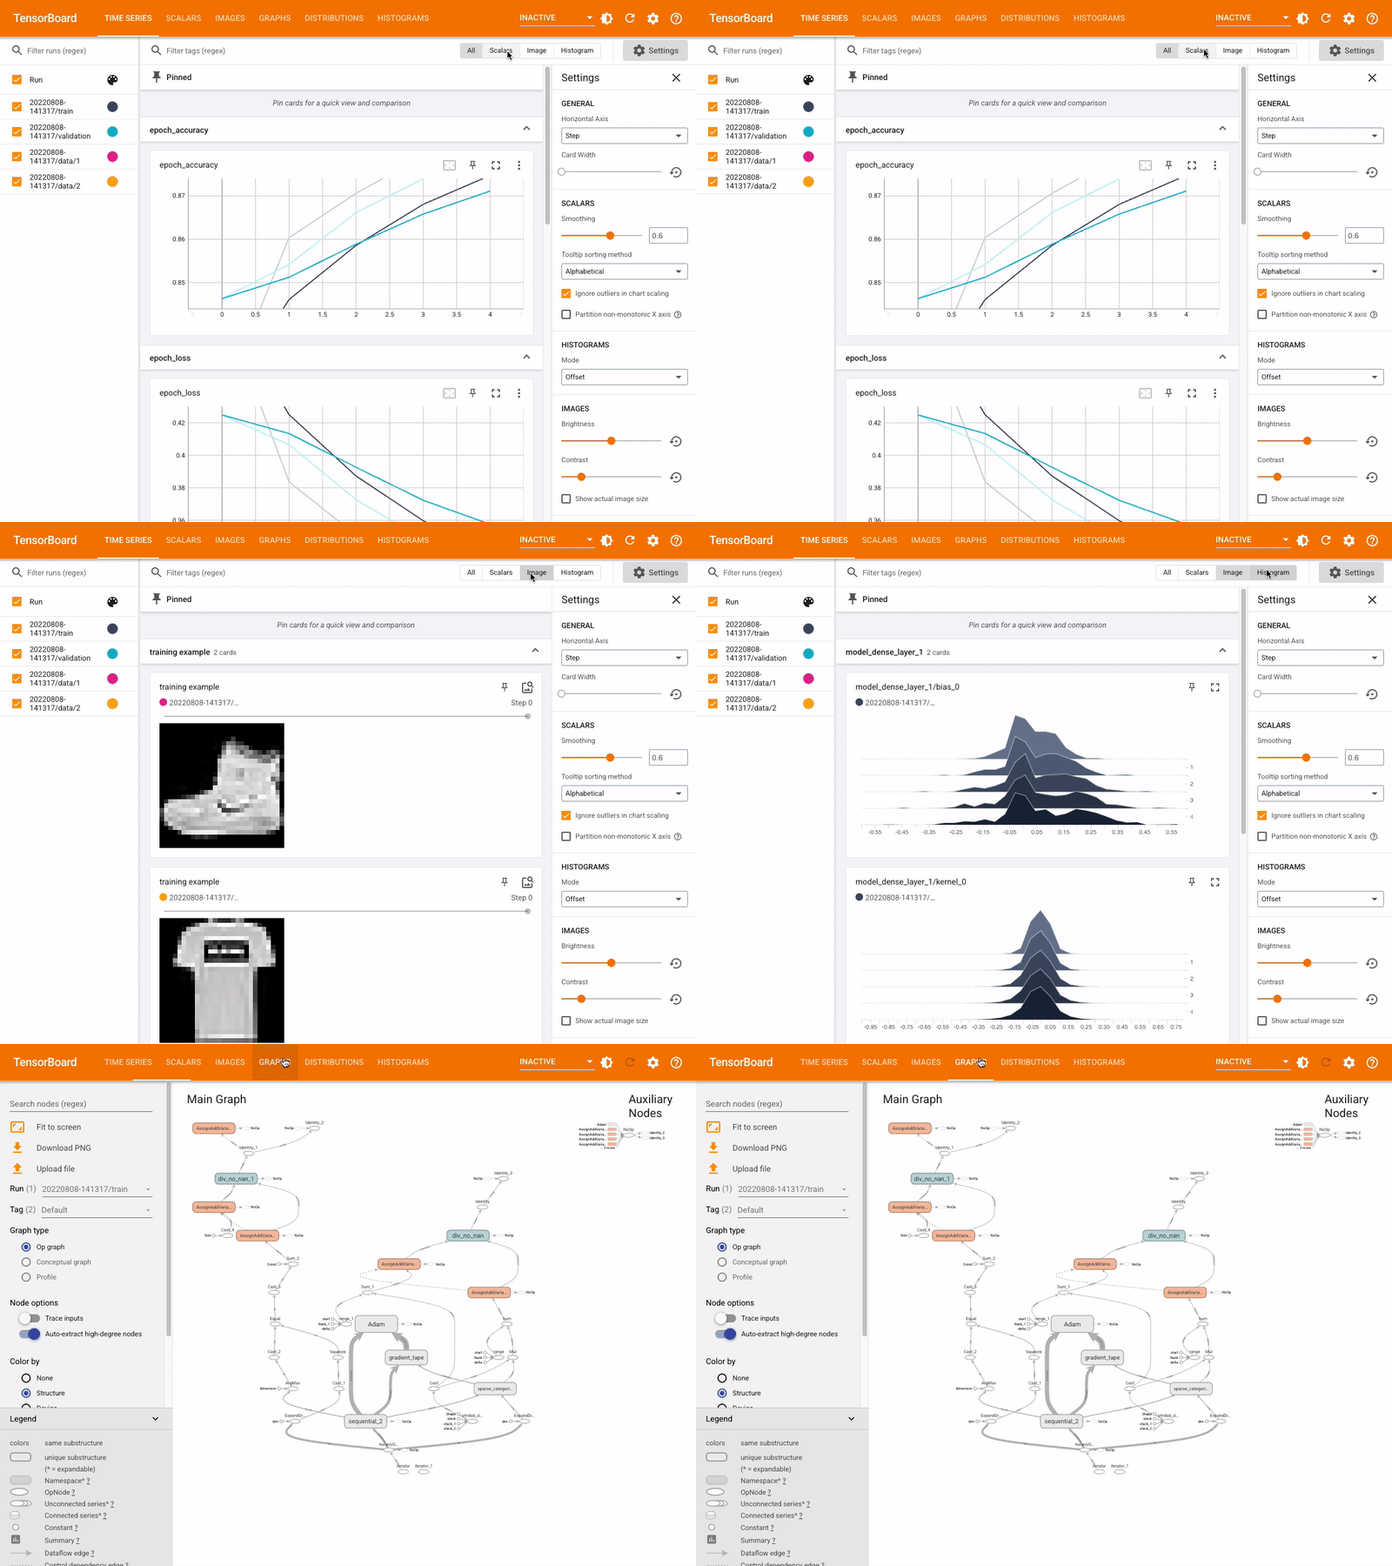
TensorBoard 提供機器學習實驗所需的視覺化呈現和工具:
- 追蹤損失和準確率等指標,並以視覺化的方式呈現
- 以視覺化的方式呈現模型圖 (運算和層)
- 檢視權重、偏誤或其他張量隨時間變化的直方圖
- 將嵌入投影至較低維度的空間
- 顯示圖片、文字和音訊資料
- 剖析 TensorFlow 程式
- 還有更多功能
TensorBoard.dev 可讓您輕鬆代管、追蹤及分享實驗結果。
[{
"type": "thumb-down",
"id": "missingTheInformationINeed",
"label":"缺少我需要的資訊"
},{
"type": "thumb-down",
"id": "tooComplicatedTooManySteps",
"label":"過於複雜/步驟過多"
},{
"type": "thumb-down",
"id": "outOfDate",
"label":"過時"
},{
"type": "thumb-down",
"id": "translationIssue",
"label":"翻譯問題"
},{
"type": "thumb-down",
"id": "samplesCodeIssue",
"label":"示例/程式碼問題"
},{
"type": "thumb-down",
"id": "otherDown",
"label":"其他"
}]
[{
"type": "thumb-up",
"id": "easyToUnderstand",
"label":"容易理解"
},{
"type": "thumb-up",
"id": "solvedMyProblem",
"label":"確實解決了我的問題"
},{
"type": "thumb-up",
"id": "otherUp",
"label":"其他"
}]