
 GitHub でソースを表示 GitHub でソースを表示 |
概要
機械学習のアルゴリズムは通常、計算のコストがかかります。そのため、機械学習アプリケーションのパフォーマンスを数値化して、最もよく最適化されたバージョンのモデルを実行するようにする必要があります。TensorFlow Profiler を使用して、TensorFlow コードの実行をプロファイリングしましょう。
セットアップ
from datetime import datetime
from packaging import version

import os
TensorFlow Profiler には、最新バージョンの TensorFlow と TensorBoard(2.2 以上)が必要です。
pip install -U tensorboard_plugin_profileimport tensorflow as tf
print("TensorFlow version: ", tf.__version__)
TensorFlow version: 2.2.0-dev20200405
TensorFlow が GPU にアクセスできることを確認します。
device_name = tf.test.gpu_device_name()
if not device_name:
  raise SystemError('GPU device not found')
print('Found GPU at: {}'.format(device_name))
Found GPU at: /device:GPU:0
TensorBoard コールバックを使って、画像分類モデルをトレーニングする
このチュートリアルでは、MNIST データセットの画像を分類するモデルをトレーニングすることで取得されるパフォーマンスプロファイルをキャプチャしながら、TensorFlow Profiler の機能を確認します。
TensorFlow データセットを使って、トレーニングデータをインポートし、それを トレーニングとテストのセットに分割します。
import tensorflow_datasets as tfds
tfds.disable_progress_bar()
(ds_train, ds_test), ds_info = tfds.load(
    'mnist',
    split=['train', 'test'],
    shuffle_files=True,
    as_supervised=True,
    with_info=True,
)
WARNING:absl:Dataset mnist is hosted on GCS. It will automatically be downloaded to your
local data directory. If you'd instead prefer to read directly from our public
GCS bucket (recommended if you're running on GCP), you can instead set
data_dir=gs://tfds-data/datasets.
Downloading and preparing dataset mnist/3.0.0 (download: 11.06 MiB, generated: Unknown size, total: 11.06 MiB) to /root/tensorflow_datasets/mnist/3.0.0...
Dataset mnist downloaded and prepared to /root/tensorflow_datasets/mnist/3.0.0. Subsequent calls will reuse this data.
トレーニングとテストのデータについて、ピクセル値が 0 から 1 の値となるように正規化して前処理します。
def normalize_img(image, label):
  """Normalizes images: `uint8` -> `float32`."""
  return tf.cast(image, tf.float32) / 255., label

ds_train = ds_train.map(normalize_img)
ds_train = ds_train.batch(128)
ds_test = ds_test.map(normalize_img)
ds_test = ds_test.batch(128)
Keras を使用して、画像分類モデルを作成します。
model = tf.keras.models.Sequential([
  tf.keras.layers.Flatten(input_shape=(28, 28, 1)),
  tf.keras.layers.Dense(128,activation='relu'),
  tf.keras.layers.Dense(10, activation='softmax')
])
model.compile(
    loss='sparse_categorical_crossentropy',
    optimizer=tf.keras.optimizers.Adam(0.001),
    metrics=['accuracy']
)
パフォーマンスプロファイルをキャプチャする TensorBoard コールバックを作成し、モデルのトレーニング中にそれを呼び出します。
# Create a TensorBoard callback
logs = "logs/" + datetime.now().strftime("%Y%m%d-%H%M%S")

tboard_callback = tf.keras.callbacks.TensorBoard(log_dir = logs,
                                                 histogram_freq = 1,
                                                 profile_batch = '500,520')

model.fit(ds_train,
          epochs=2,
          validation_data=ds_test,
          callbacks = [tboard_callback])
Epoch 1/2
469/469 [==============================] - 11s 22ms/step - loss: 0.3684 - accuracy: 0.8981 - val_loss: 0.1971 - val_accuracy: 0.9436
Epoch 2/2
 50/469 [==>...........................] - ETA: 9s - loss: 0.2014 - accuracy: 0.9439WARNING:tensorflow:From /usr/local/lib/python3.6/dist-packages/tensorflow/python/ops/summary_ops_v2.py:1271: stop (from tensorflow.python.eager.profiler) is deprecated and will be removed after 2020-07-01.
Instructions for updating:
use `tf.profiler.experimental.stop` instead.
WARNING:tensorflow:From /usr/local/lib/python3.6/dist-packages/tensorflow/python/ops/summary_ops_v2.py:1271: stop (from tensorflow.python.eager.profiler) is deprecated and will be removed after 2020-07-01.
Instructions for updating:
use `tf.profiler.experimental.stop` instead.
469/469 [==============================] - 11s 24ms/step - loss: 0.1685 - accuracy: 0.9525 - val_loss: 0.1376 - val_accuracy: 0.9595
<tensorflow.python.keras.callbacks.History at 0x7f23919a6a58>
TensorFlow Profiler を使ってモデルのトレーニングパフォーマンスをプロファイリングする
TensorFlow Profiler は TensorBoard 内に組み込まれています。Colab マジックを使って TensorBoard を読み込み、起動したら、Profile タブに移動してパフォーマンスプロファイルを表示します。
# Load the TensorBoard notebook extension.
%load_ext tensorboard
このモデルのパフォーマンスプロファイルは下の画像のようになります。
# Launch TensorBoard and navigate to the Profile tab to view performance profile
%tensorboard --logdir=logs
<IPython.core.display.Javascript object>
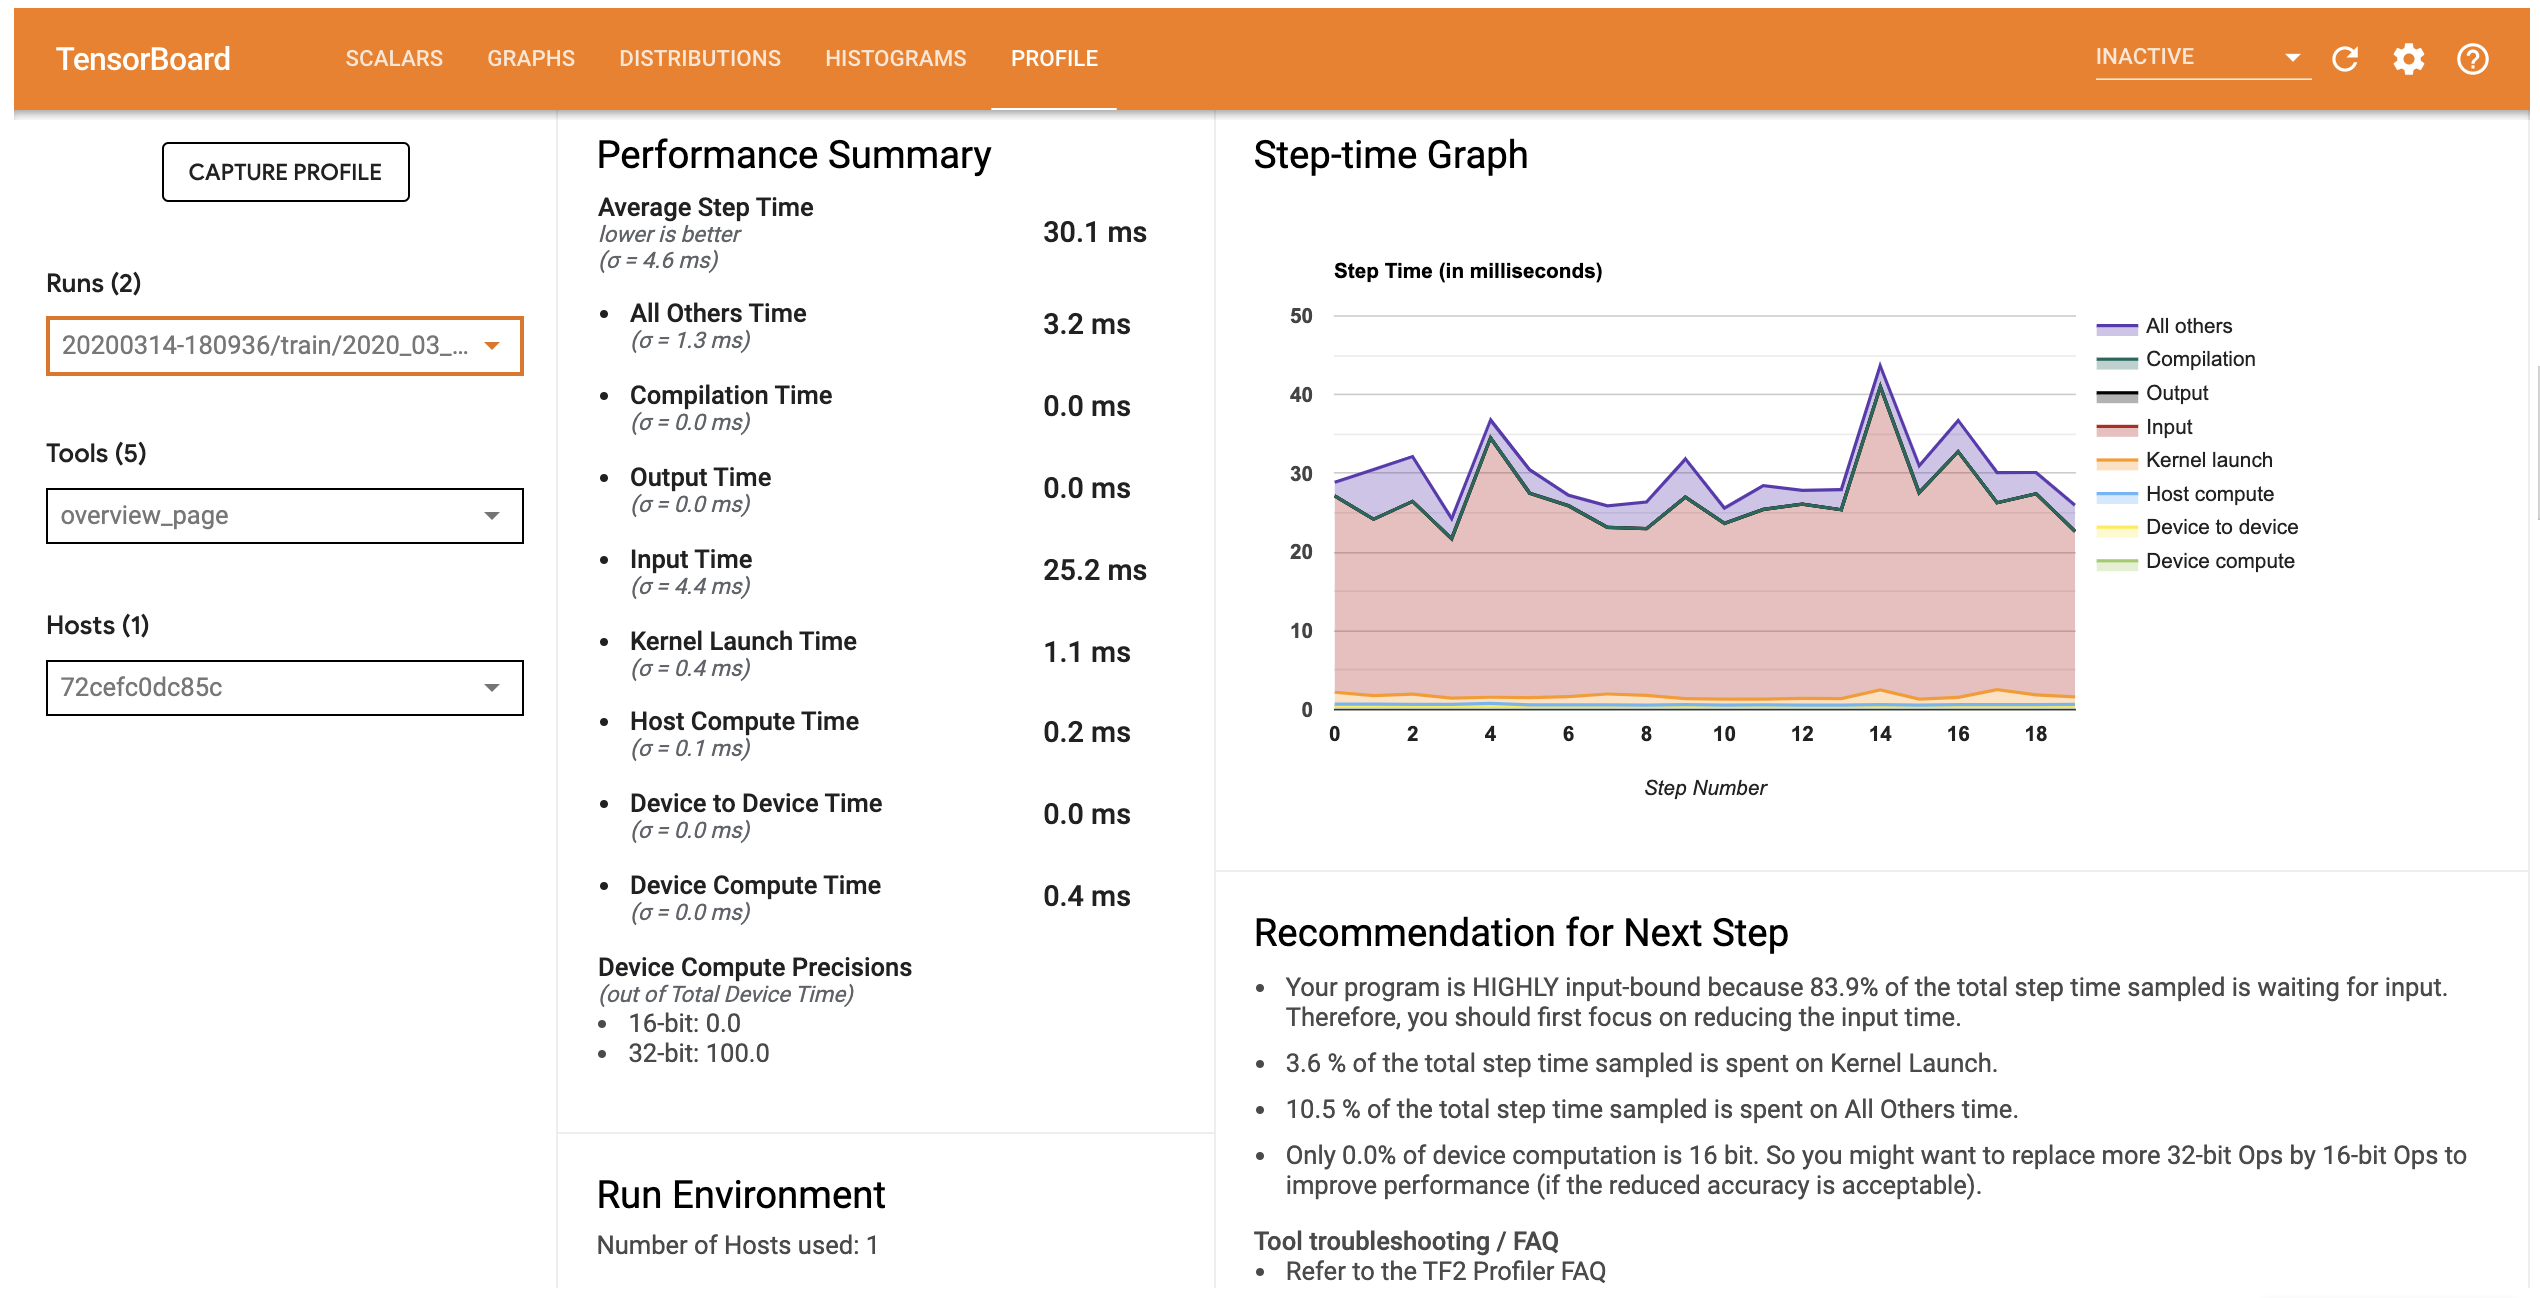
Profile タブには、モデルパフォーマンスに関する高レベルの概要を示す画用ページが表示されます。右側の Ste-time Graph(ステップ時間グラフ)を見ると、モデルが高度に入力バウンドである(データ入力パイプラインに長時間を費やしている)ことがわかります。概要ページは、モデルパフォーマンスを最適化するために実行できる可能性のある次のステップも推奨します。
入力パイプラインのどこでパフォーマンスのボトルネックが発生しているのかを理解するには、左側の Toolsドロップダウンから Trace Viewer を選択します。Trace Viewer には、プロファイル期間中に CPU と GPU で発生したさまざまなイベントのタイムラインが示されます。
Trace Viewer では、縦軸に複数のイベントグループが表示されます。各イベントグループにはトレースイベントで塗りつぶされた複数の水平トラックがあります。このトラックはスレッドまたは GPU ストリームで実行されたイベントのイベントタイムラインです。それぞれのイベントは、タイムライントラック上に色付きの矩形ブロックで示されます。時間は左から右に移動します。トレースイベントはキーボードショートカットの W(拡大)、S(縮小)、A(左にスクロール)、D(右にスクロール)を使ってナビゲートします。
1 つの矩形はトレースイベントを表します。フロートツールバーのマウスカーソルアイコンを選択(またはキーボードショートカットの 1 を使用)して分析するトレースイベントをクリックすると、その開始時間や期間といったイベントに関する情報が表示されます。
クリックの他に、マウスをドラッグしてトレースイベントのグループを選択することもできます。この操作では、その選択領域のすべてのイベントのリストとイベントの要約が表示されます。M キーを使うと、選択したイベントの期間を測定することができます。
トレースイベントは次の項目から収集されます。
- CPU: CPU イベントは
/host:CPUというイベントグループの下に表示されます。各トラックは、CPU 上のスレッドを表します。CPU イベントには入力パイプラインイベント、GPU 演算(演算子)のスケジュールイベント、CPU 演算実行イベントなどが含まれます。 - GPU: GPU イベントは
/device:GPU:という接頭辞のついたイベントグループの下に表示されます。各イベントグループは GPU 上の 1 ストリームを表します。
パフォーマンスボトルネックをデバッグする
Trace Viewer を使用して、入力パイプラインのパフォーマンスに発生しているボトルネックの場所を特定します。下の画像は、パフォーマンスプロファイルのスナップショットです。
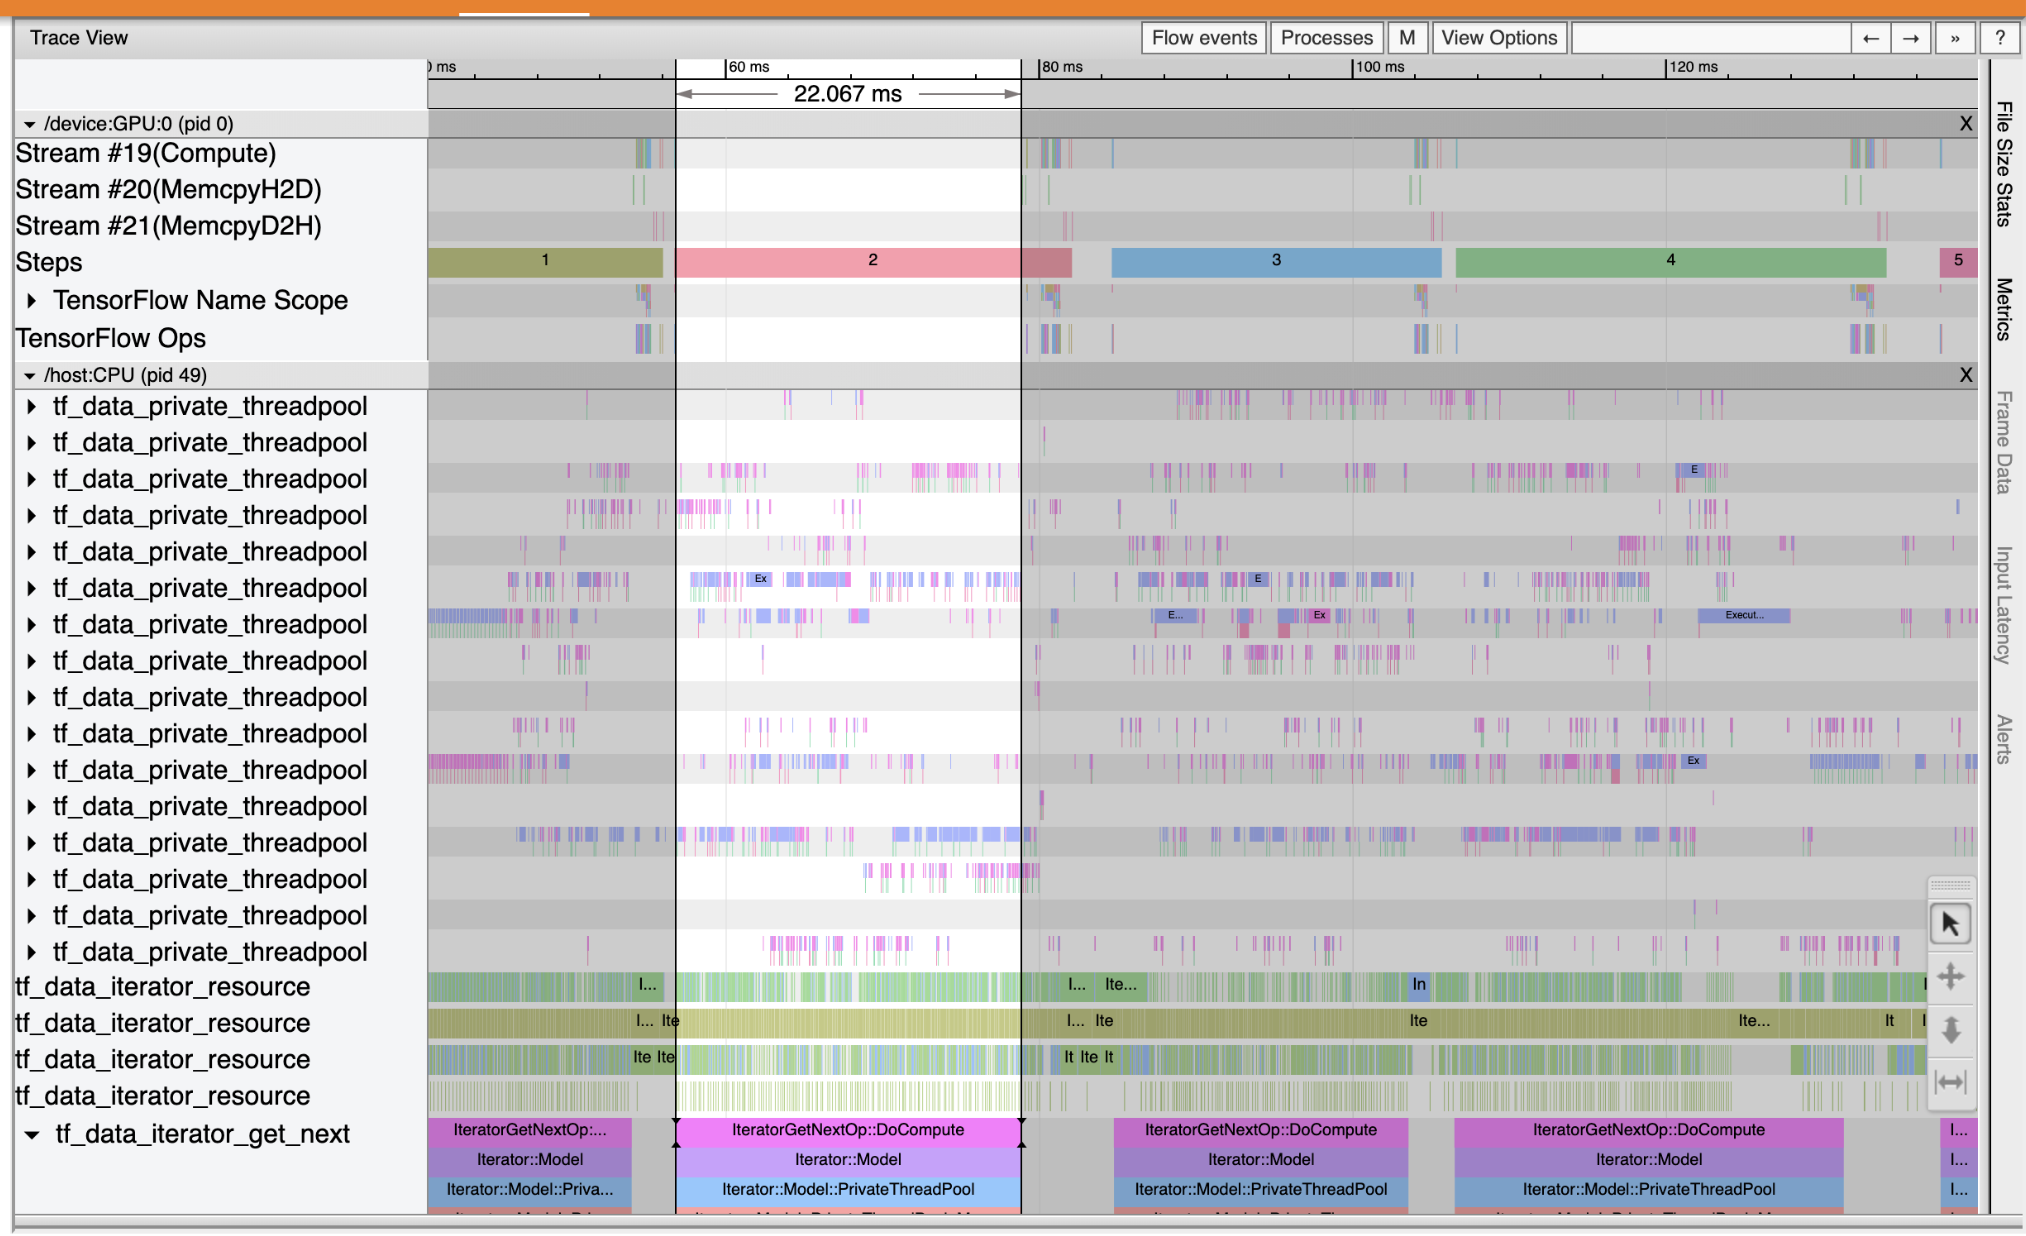
イベントトレースを見ると、CPU 上で tf_data_iterator_get_next が実行している間、GPU は非アクティブであることがわかります。この演算子は、入力データの処理を行っており、トレーニングを行うために GPU に送信しています。一般的な経験則として、デバイス(GPU/TPU)を常にアクティブな状態に維持しておくのが良いといえます。
入力パイプラインを最適化するには tf.data API を使用します。この場合は、GPU が常に処理できるデータが存在するように、トレーニングデータセットをキャッシュしてデータをプリフェッチしましょう。tf.data を使用して入力パイプラインを最適化する方法の詳細については、こちらをご覧ください。
(ds_train, ds_test), ds_info = tfds.load(
    'mnist',
    split=['train', 'test'],
    shuffle_files=True,
    as_supervised=True,
    with_info=True,
)
ds_train = ds_train.map(normalize_img)
ds_train = ds_train.batch(128)
ds_train = ds_train.cache()
ds_train = ds_train.prefetch(tf.data.experimental.AUTOTUNE)
ds_test = ds_test.map(normalize_img)
ds_test = ds_test.batch(128)
ds_test = ds_test.cache()
ds_test = ds_test.prefetch(tf.data.experimental.AUTOTUNE)
モデルを再トレーニング後、前に使用したコールバックを再利用して、パフォーマンスのプロファイルをキャプチャします。
model.fit(ds_train,
          epochs=2,
          validation_data=ds_test,
          callbacks = [tboard_callback])
Epoch 1/2
469/469 [==============================] - 10s 22ms/step - loss: 0.1194 - accuracy: 0.9658 - val_loss: 0.1116 - val_accuracy: 0.9680
Epoch 2/2
469/469 [==============================] - 1s 3ms/step - loss: 0.0918 - accuracy: 0.9740 - val_loss: 0.0979 - val_accuracy: 0.9712
<tensorflow.python.keras.callbacks.History at 0x7f23908762b0>
TensorBoard をもう一度起動し、Profile タブを開いて、更新された入力パイプラインのパフォーマンスプロファイルを観測します。
最適化された入力パイプラインのパフォーマンスプロファイルは下の画像のようになります。
%tensorboard --logdir=logs
Reusing TensorBoard on port 6006 (pid 750), started 0:00:12 ago. (Use '!kill 750' to kill it.)
<IPython.core.display.Javascript object>
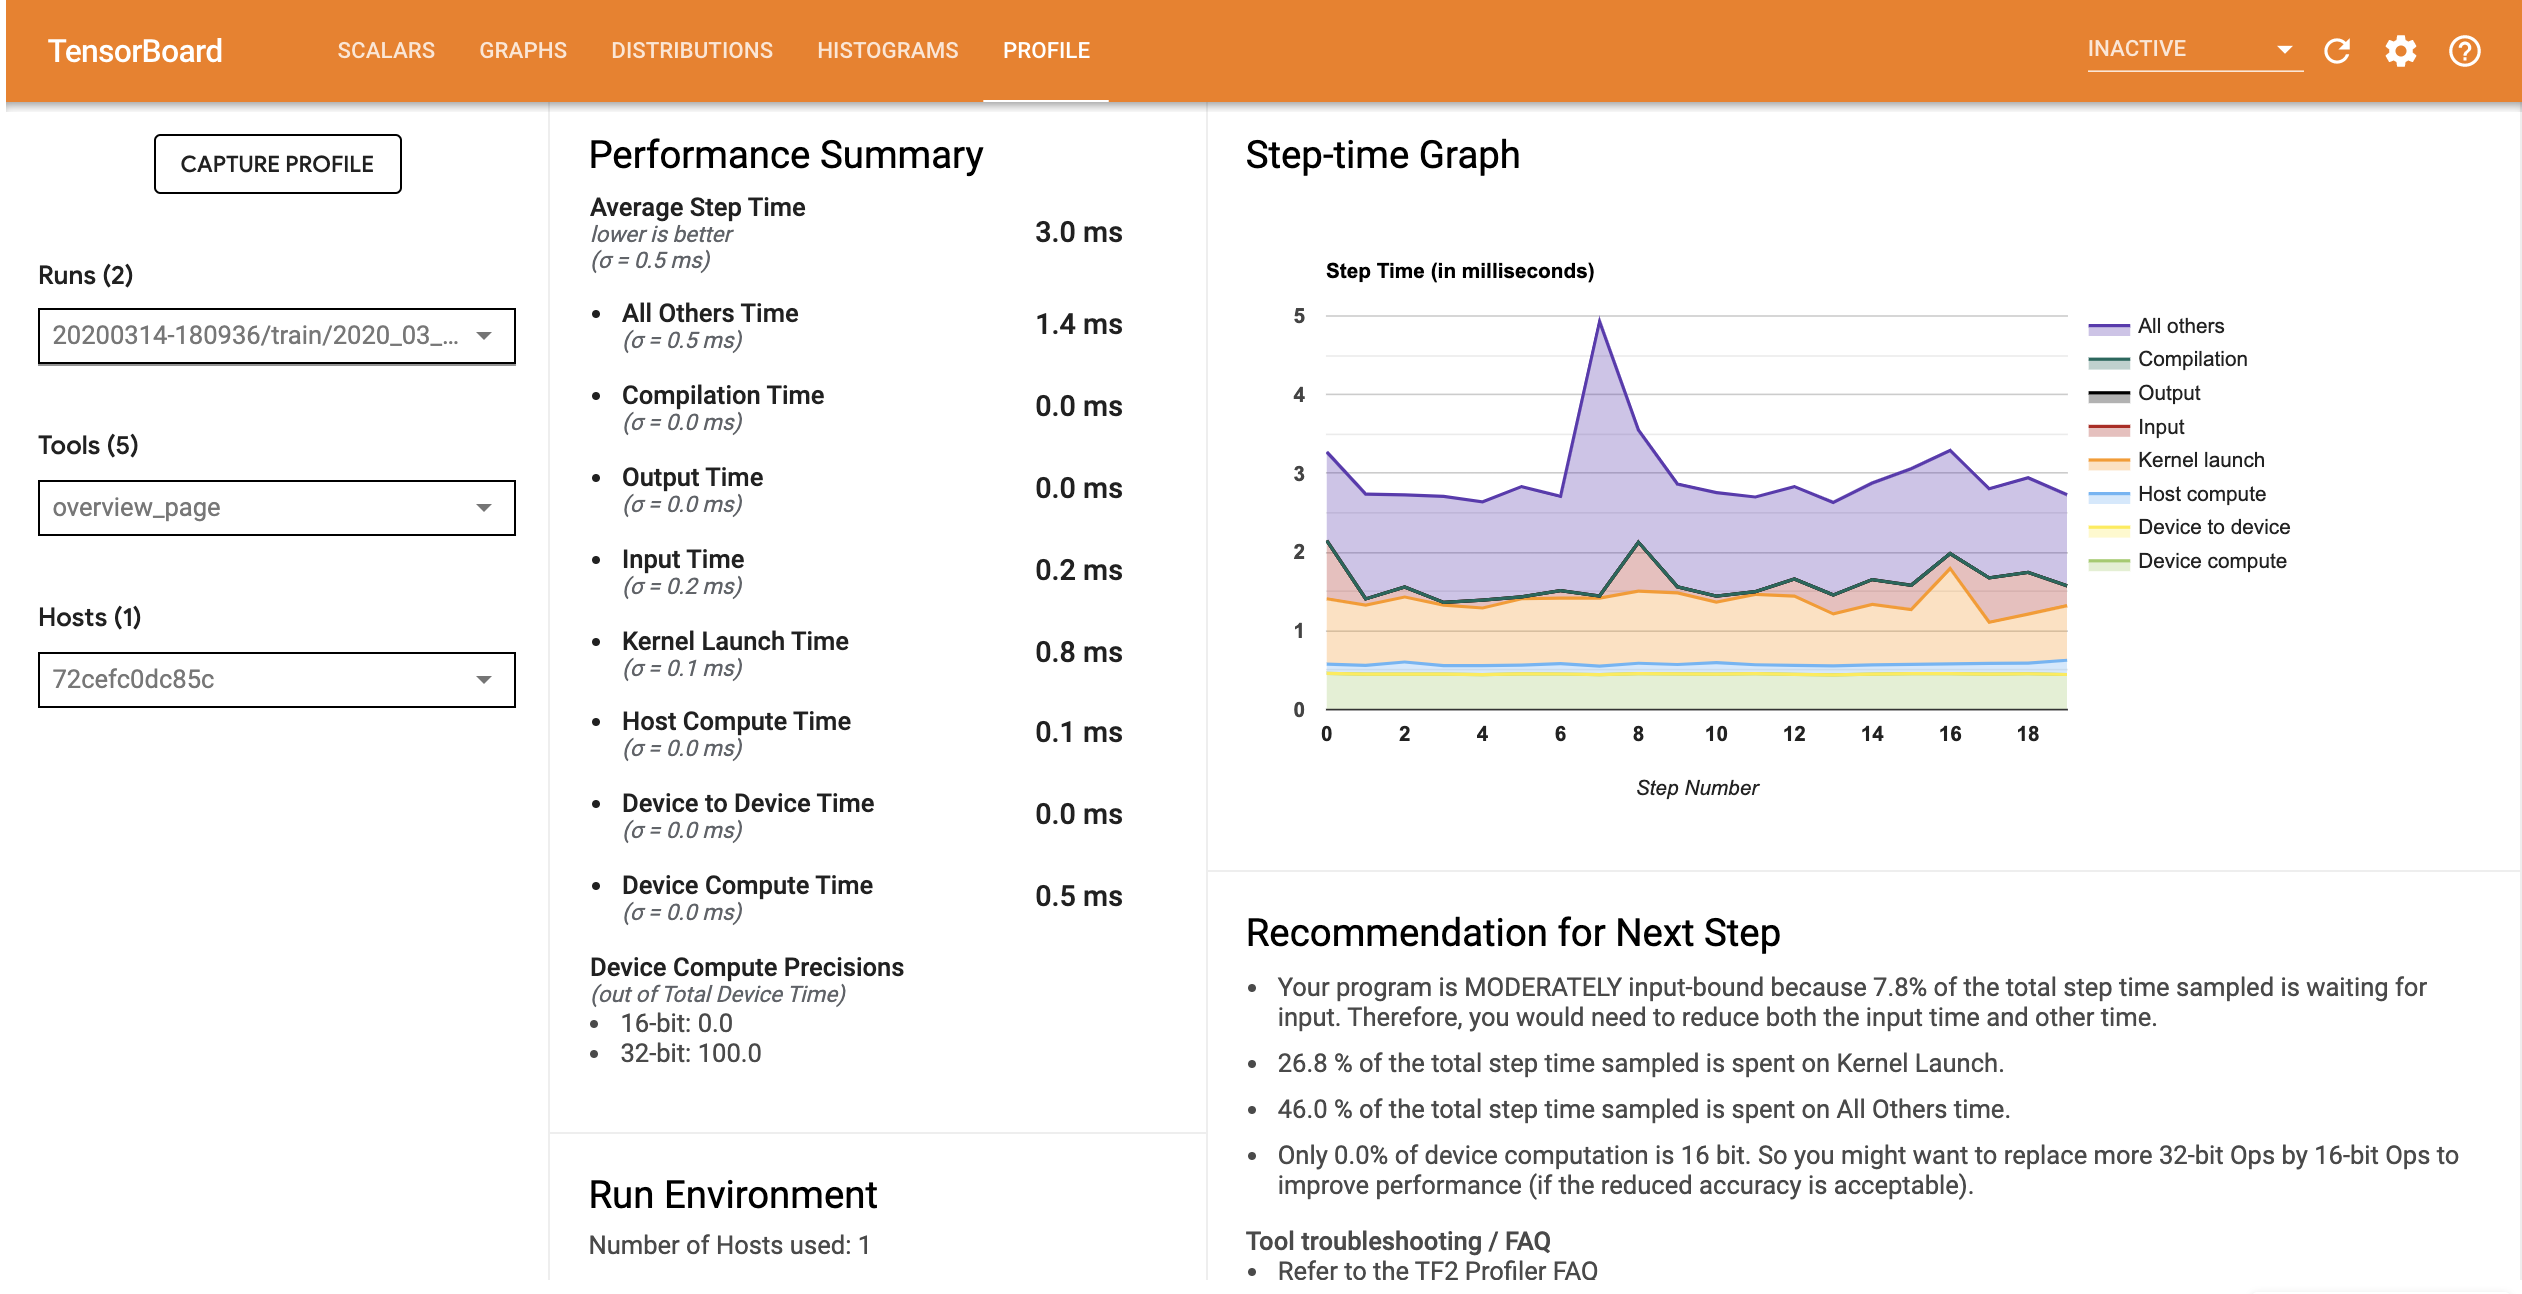
概要ページで、Average Step time(平均ステップ時間)と Input Step time(入力ステップ時間)と同様に減少していることがわかります。Step-time Graph にも、モデルが高度な入力バウンドでなくなったことが示されています。Trace Viewer を開き、最適化された入力パイプラインのトレースイベントを調べてみましょう。
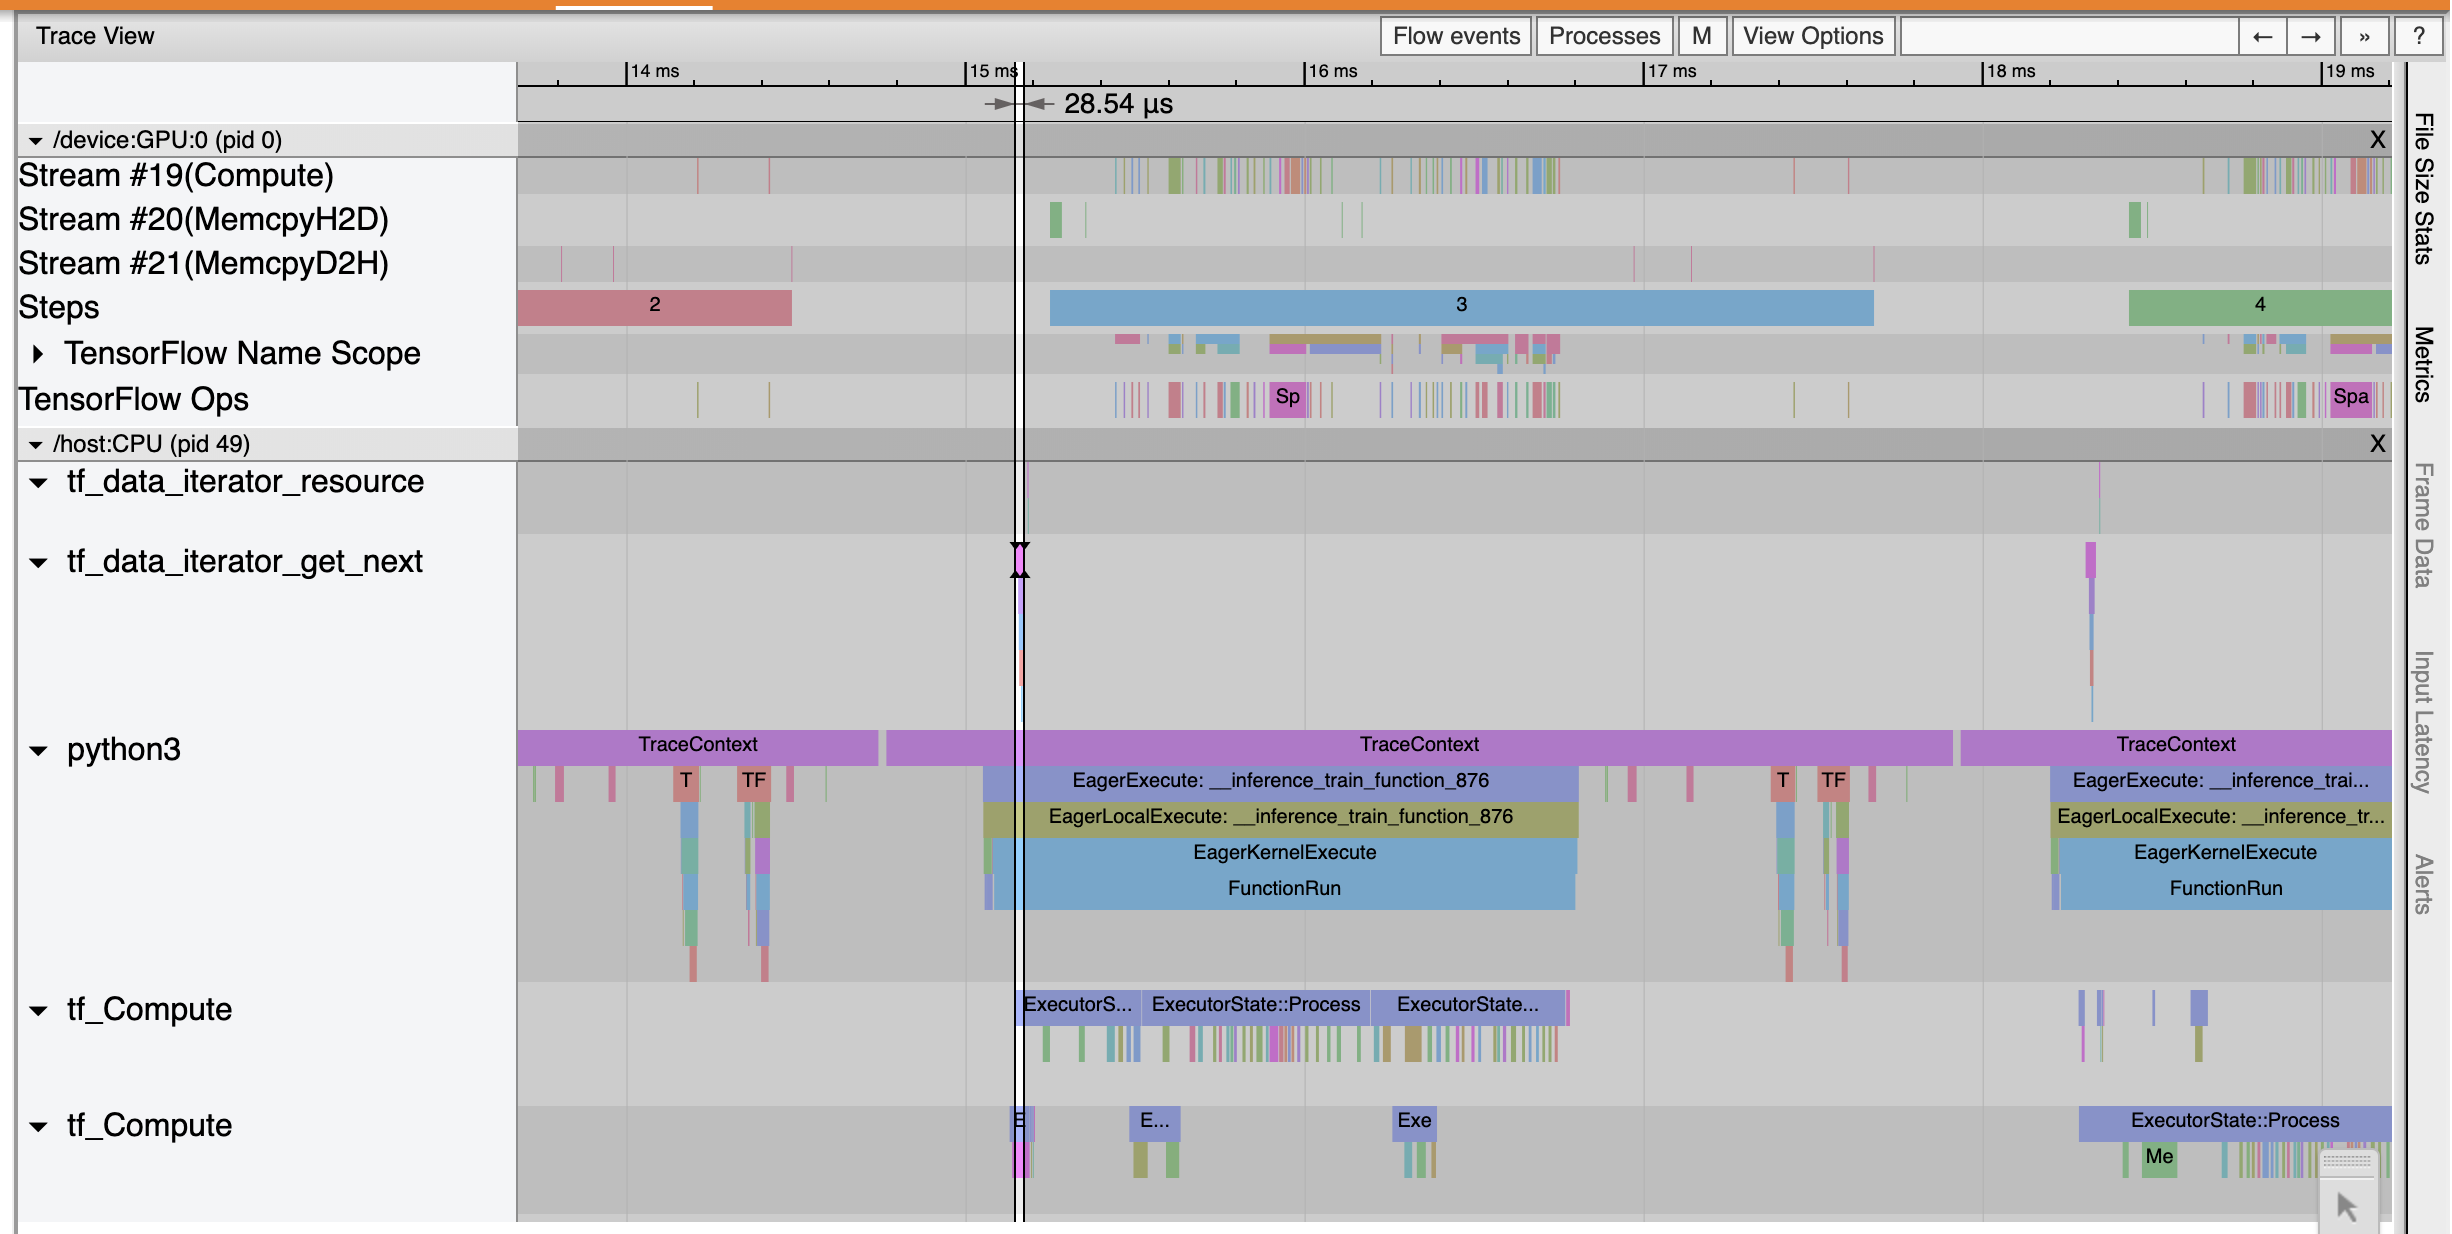
Trace Viewer には、tf_data_iterator_get_next 演算の実行が非常に高速化していることが示されています。そのため、GPU のデータストリームが安定した状態でトレーニングを実行できており、モデルのトレーニングを通して、使用率が大幅に改善されています。
まとめ
モデルのトレーニングパフォーマンスをプロファイリングしてデバッグするには、TensorFlow Profiler を使用します。TensorFlow Profiler についての詳細は、Profiler ガイドに目を通し、TensorFlow Dev Summit 2020 の Performance profiling in TF 2 に関する講演内容をご覧ください。