
After deploying TensorFlow Serving and issuing requests from your client, you may notice that requests take longer than you expected, or you are not achieving the throughput that you would have liked.
In this guide, we will use TensorBoard's Profiler, which you may already use to profile model training, to trace inference requests to help us debug and improve inference performance.
You should use this guide in conjunction with the best practices denoted in the Performance Guide to optimize your model, requests and TensorFlow Serving instance.
Overview
At a high level, we will point TensorBoard's Profiling tool at TensorFlow
Serving's gRPC server. When we send an inference request to Tensorflow Serving,
we will also simultaneously use the TensorBoard UI to ask it to capture the
traces of this request. Behind the scenes, TensorBoard will talk to TensorFlow
Serving over gRPC and ask it to provide a detailed trace of the lifetime of the
inference request. TensorBoard will then visualize the activity of every thread
on every compute device (running code integrated with
profiler::TraceMe)
over the course of the lifetime of the request on the TensorBoard UI for us to
consume.
Prerequisites
Tensorflow>=2.0.0- TensorBoard (should be installed if TF was installed via
pip) - Docker (which we'll use to download and run TF serving>=2.1.0 image)
Deploy model with TensorFlow Serving
For this example, we will use Docker, the recommended way to deploy Tensorflow
Serving, to host a toy model that computes f(x) = x / 2 + 2 found in the
Tensorflow Serving Github repository.
Download the TensorFlow Serving source.
git clone https://github.com/tensorflow/serving /tmp/serving
cd /tmp/serving
Launch TensorFlow Serving via Docker and deploy the half_plus_two model.
docker pull tensorflow/serving
MODELS_DIR="$(pwd)/tensorflow_serving/servables/tensorflow/testdata"
docker run -it --rm -p 8500:8500 -p 8501:8501 \
-v $MODELS_DIR/saved_model_half_plus_two_cpu:/models/half_plus_two \
-v /tmp/tensorboard:/tmp/tensorboard \
-e MODEL_NAME=half_plus_two \
tensorflow/serving
In another terminal, query the model to ensure model is deployed correctly
curl -d '{"instances": [1.0, 2.0, 5.0]}' \
-X POST http://localhost:8501/v1/models/half_plus_two:predict

# Returns => { "predictions": [2.5, 3.0, 4.5] }
Set up TensorBoard's Profiler
In another terminal, launch the TensorBoard tool on your machine, providing a directory to save the inference trace events to:
mkdir -p /tmp/tensorboard
tensorboard --logdir /tmp/tensorboard --port 6006
Navigate to http://localhost:6006/ to view the TensorBoard UI. Use the drop-down menu at the top to navigate to the Profile tab. Click Capture Profile and provide the address of Tensorflow Serving's gRPC server.
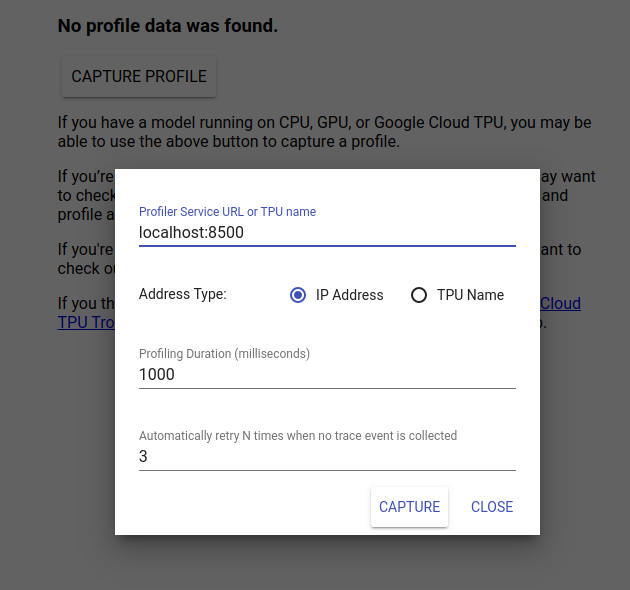
As soon as you press "Capture," TensorBoard will start sending profile requests to the model server. In the dialog above, you can set both the deadline for each request and the total number of times Tensorboard will retry if no trace events are collected. If you are profiling an expensive model, you may want to increase the deadline to ensure the profile request does not time out before the inference request completes.
Send and Profile an Inference Request
Press Capture on the TensorBoard UI and send an inference request to TF Serving quickly thereafter.
curl -d '{"instances": [1.0, 2.0, 5.0]}' -X POST \
http://localhost:8501/v1/models/half_plus_two:predict
You should see a "Capture profile successfully. Please refresh." toast appear at
the bottom of the screen. This means TensorBoard was able to retrieve trace
events from TensorFlow Serving and saved them to your logdir. Refresh the page
to visualize the inference request with The Profiler's Trace Viewer, as seen in
the next section.
Analyze the Inference Request Trace

You can now easily see what computation is taking place as a result of your inference request. You can zoom and click on any of the rectangles (trace events) to get more information such as exact start time and wall duration.
At a high-level, we see two threads belonging to the TensorFlow runtime and a third one that belongs to the REST server, handling the receiving of the HTTP request and creating a TensorFlow Session.
We can zoom in to see what happens inside the SessionRun.

In the second thread, we see an initial ExecutorState::Process call in which no TensorFlow ops run but initialization steps are executed.
In the first thread, we see the call to read the first variable, and once the second variable is also available, executes the multiplication and add kernels in sequence. Finally, the Executor signals that its computation is done by calling the DoneCallback and the Session can be closed.
Next Steps
While this is a simple example, you can use the same process to profile much more complex models, allowing you to identify slow ops or bottlenecks in your model architecture to improve its performance.
Please refer to TensorBoard Profiler Guide for a more complete tutorial on features of TensorBoard's Profiler and TensorFlow Serving Performance Guide to learn more about optimizing inference performance.