
Visual Studio Code (VSCode) is a free code editor, which runs on the macOS, Linux, and Windows operating systems. It has elegant tooling support which supports Python & C++ development, visual debugging, integration with git and many more interesting features. Owing to the ease of use and extension management, it is a great editor for TensorFlow IO development. However, some effort is necessary to configure it properly. Since VSCode configuration is very flexible, it allows developers to compile project using bazel and run the code under Python and C++ debuggers. The base tool setup might differ based on the operation systems, but the configuration approach should be similar.
Extensions
To install an extension click the extensions view icon (Extensions) on the Sidebar, or use the shortcut Ctrl+Shift+X. Then search for keyword below.
- C/C++ - Official C++ extension from Microsoft
- Python - Official Python extension from Microsoft
- Python Extension Pack - another useful extension for Python development
Compiling projects
TensorFlow IO is compiled using bazel build command:
bazel build -s --verbose_failures --compilation_mode dbg //tensorflow_io/...
See project README file for details on how to setup development environment in Ubuntu. --compilation_mode dbg flag here indicates that produced binary should have debug symbols. Once you can compile project from command line, you can also configure VSCode to be able to invoke same command.
Open View->Command Pallete (Ctrl+Shift+P) and start typing: "Tasks: Configure Build Task". If you are doing this for the first time, editor is going to suggest creating tasks.json file. Once you have it, paste the following json:
{
    "version": "2.0.0",
    "tasks": [
        {
            "label": "Build TF.IO (Debug)",
            "type": "shell",
            "command": "bazel build -s --verbose_failures --compilation_mode dbg //tensorflow_io/...",
            "group": {
                "kind": "build",
                "isDefault": true
            },
            "problemMatcher": []
        }
    ]
}
Now, you can press Ctrl+Shift+B, and VSCode is going to use the command above to build the project. It uses its own terminal window, where all links are clickable. So when a compilation error occurs, you open the corresponding file and navigate to the line by just clicking on the link in the terminal window.
Debugging projects
Debugging Python code is trivial, follow official documentation to figure out how to configure VSCode to enable that: https://code.visualstudio.com/docs/python/debugging
However, debugging C++ code requires GDB to be installed on your system. If you have a bq_sample_read.py python script that uses tensorflow-io library and is normally executed in the follow manner:
python3 bq_sample_read.py --gcp_project_id=...
You can execute it under GDB using the following:
gdb -ex r --args python3 bq_sample_read.py --gcp_project_id=...
If the application crashes in the C++ code phase, you can run backtrace in GDB console to get the stacktrace of the error.
VSCode also has GDB debugger support. It allows adding breakpoints, observe values of variables and step through the code in a step by step manner. To add debug configuration press the Debug View icon (Debug) on the Sidebar, or use the shortcut Ctrl+Shift+D. Here, press the little down arrow next to the play button and select "Add Configuration...". It will now create a launch.json file, to which, please add the following config:
{
    "name": "(gdb) Launch",
    "type": "cppdbg",
    "request": "launch",
    "program": "/usr/bin/python3",
    "args": ["bq_sample_read.py", "--gcp_project_id=..."],
    "stopAtEntry": false,
    "cwd": "${workspaceFolder}",
    "environment": [
        {
            /* path to your bazel-bin folder */
            "name": "TFIO_DATAPATH",
            "value": "/usr/local/google/home/io/bazel-bin"
        },
        {
            /* other env variables to use */
            "name": "GOOGLE_APPLICATION_CREDENTIALS",
            "value": "..."
        }
    ],
    "externalConsole": false,
    "MIMode": "gdb",
    "setupCommands": [
        {
            "description": "Enable pretty-printing for gdb",
            "text": "-enable-pretty-printing",
            "ignoreFailures": true
        }
    ]
}
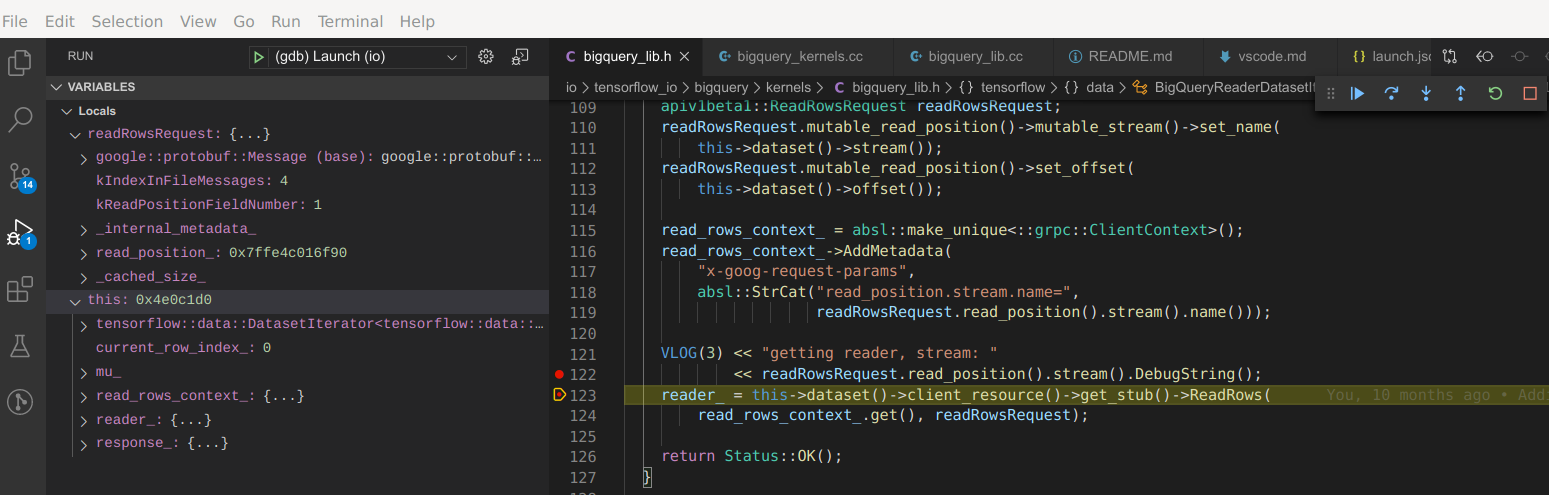
If everything is configured correctly, you should be able to do Run -> Start Debugging (F5) or Run -> Run Without Debugging (Ctrl + F5). This will run your code under debugger:
In order to further simplify the debugging experience, you can configure GDB to skip standard C++ libraries. This allows you to ignore the code that you don't care about. To do this, create a ~/.gdbinit file with the following content:
skip -gfi /usr/include/c++/*/*/*
skip -gfi /usr/include/c++/*/*
skip -gfi /usr/include/c++/*
Formatting files
You can always reformat C++ or Python file by Right Click -> Format Document (Ctrl + Shift + I), but VSCode uses a different style convention. Luckily, it is easy to change.
For Python formatting, see https://donjayamanne.github.io/pythonVSCodeDocs/docs/formatting/
For C++ formatting, do the following:
- Go to Preferences -> Settings
- Search for "C_Cpp.clang_format_fallbackStyle"
- Modify the
file:setting.jsonfile directly by adding the following content
"C_Cpp.clang_format_fallbackStyle": "{ BasedOnStyle: Google}"