
|
|
|
 View on GitHub View on GitHub
|
|
Background
This notebook demonstrates how to generate a model card using the Model Card Toolkit with a scikit-learn model in a Jupyter/Colab environment. You can learn more about model cards at https://modelcards.withgoogle.com/about.
Setup
We first need to install and import the necessary packages.
Upgrade to Pip 20.2 and Install Packages
pip install --upgrade pip==21.3pip install -U seaborn scikit-learn model-card-toolkit
Did you restart the runtime?
If you are using Google Colab, the first time that you run the cell above, you must restart the runtime (Runtime > Restart runtime ...).
Import packages
We import necessary packages, including scikit-learn.
from datetime import date
from io import BytesIO
from IPython import display
import model_card_toolkit as mctlib
from sklearn.datasets import load_breast_cancer
from sklearn.ensemble import GradientBoostingClassifier
from sklearn.model_selection import train_test_split
from sklearn.metrics import plot_roc_curve, plot_confusion_matrix

import base64
import matplotlib.pyplot as plt
import pandas as pd
import seaborn as sns
import uuid
Load data
This example uses the Breast Cancer Wisconsin Diagnostic dataset that scikit-learn can load using the load_breast_cancer() function.
cancer = load_breast_cancer()

X = pd.DataFrame(cancer.data, columns=cancer.feature_names)
y = pd.Series(cancer.target)

X_train, X_test, y_train, y_test = train_test_split(X, y)
X_train.head()
y_train.head()
17     0
117    0
195    1
337    0
509    0
dtype: int64
Plot data
We will create several plots from the data that we will include in the model card.
# Utility function that will export a plot to a base-64 encoded string that the model card will accept.

def plot_to_str():
    img = BytesIO()
    plt.savefig(img, format='png')
    return base64.encodebytes(img.getvalue()).decode('utf-8')
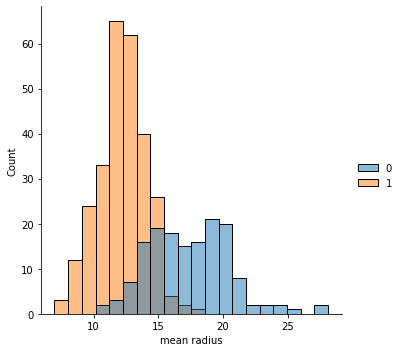
# Plot the mean radius feature for both the train and test sets
sns.displot(x=X_train['mean radius'], hue=y_train)
mean_radius_train = plot_to_str()
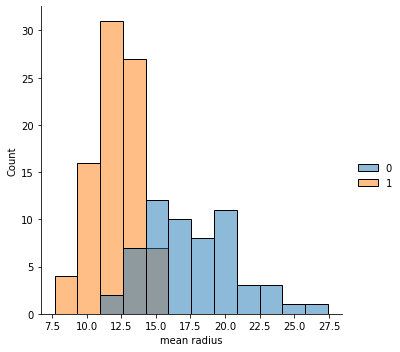
sns.displot(x=X_test['mean radius'], hue=y_test)
mean_radius_test = plot_to_str()
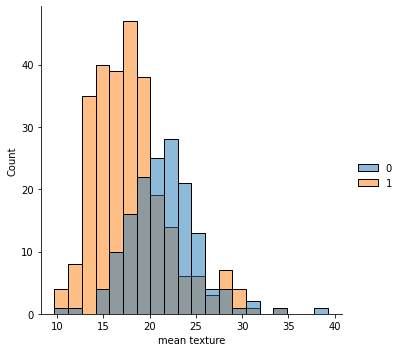
# Plot the mean texture feature for both the train and test sets
sns.displot(x=X_train['mean texture'], hue=y_train)
mean_texture_train = plot_to_str()
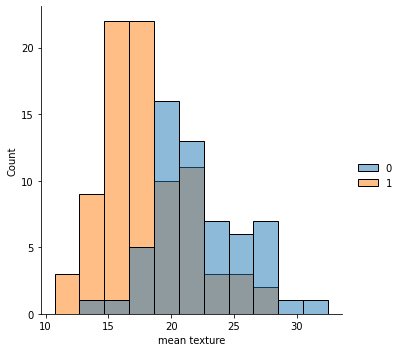
sns.displot(x=X_test['mean texture'], hue=y_test)
mean_texture_test = plot_to_str()
Train model
# Create a classifier and fit the training data

clf = GradientBoostingClassifier().fit(X_train, y_train)
Evaluate model
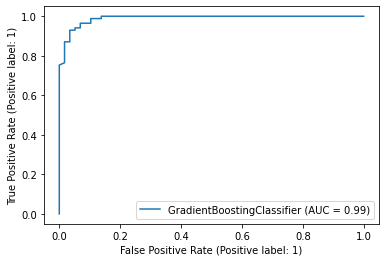
# Plot a ROC curve

plot_roc_curve(clf, X_test, y_test)
roc_curve = plot_to_str()
/tmpfs/src/tf_docs_env/lib/python3.7/site-packages/sklearn/utils/deprecation.py:87: FutureWarning: Function plot_roc_curve is deprecated; Function :func:`plot_roc_curve` is deprecated in 1.0 and will be removed in 1.2. Use one of the class methods: :meth:`sklearn.metric.RocCurveDisplay.from_predictions` or :meth:`sklearn.metric.RocCurveDisplay.from_estimator`.
  warnings.warn(msg, category=FutureWarning)
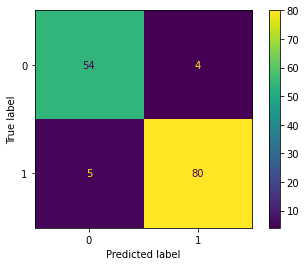
# Plot a confusion matrix

plot_confusion_matrix(clf, X_test, y_test)
confusion_matrix = plot_to_str()
/tmpfs/src/tf_docs_env/lib/python3.7/site-packages/sklearn/utils/deprecation.py:87: FutureWarning: Function plot_confusion_matrix is deprecated; Function `plot_confusion_matrix` is deprecated in 1.0 and will be removed in 1.2. Use one of the class methods: ConfusionMatrixDisplay.from_predictions or ConfusionMatrixDisplay.from_estimator.
  warnings.warn(msg, category=FutureWarning)
Create a model card
Initialize toolkit and model card
mct = mctlib.ModelCardToolkit()

model_card = mct.scaffold_assets()
Annotate information into model card
model_card.model_details.name = 'Breast Cancer Wisconsin (Diagnostic) Dataset'
model_card.model_details.overview = (
    'This model predicts whether breast cancer is benign or malignant based on '
    'image measurements.')
model_card.model_details.owners = [
    mctlib.Owner(name= 'Model Cards Team', contact='model-cards@google.com')
]
model_card.model_details.references = [
    mctlib.Reference(reference='https://archive.ics.uci.edu/ml/datasets/Breast+Cancer+Wisconsin+(Diagnostic)'),
    mctlib.Reference(reference='https://minds.wisconsin.edu/bitstream/handle/1793/59692/TR1131.pdf')
]
model_card.model_details.version.name = str(uuid.uuid4())
model_card.model_details.version.date = str(date.today())

model_card.considerations.ethical_considerations = [mctlib.Risk(
    name=('Manual selection of image sections to digitize could create '
            'selection bias'),
    mitigation_strategy='Automate the selection process'
)]
model_card.considerations.limitations = [mctlib.Limitation(description='Breast cancer diagnosis')]
model_card.considerations.use_cases = [mctlib.UseCase(description='Breast cancer diagnosis')]
model_card.considerations.users = [mctlib.User(description='Medical professionals'), mctlib.User(description='ML researchers')]

model_card.model_parameters.data.append(mctlib.Dataset())
model_card.model_parameters.data[0].graphics.description = (
  f'{len(X_train)} rows with {len(X_train.columns)} features')
model_card.model_parameters.data[0].graphics.collection = [
    mctlib.Graphic(image=mean_radius_train),
    mctlib.Graphic(image=mean_texture_train)
]
model_card.model_parameters.data.append(mctlib.Dataset())
model_card.model_parameters.data[1].graphics.description = (
  f'{len(X_test)} rows with {len(X_test.columns)} features')
model_card.model_parameters.data[1].graphics.collection = [
    mctlib.Graphic(image=mean_radius_test),
    mctlib.Graphic(image=mean_texture_test)
]
model_card.quantitative_analysis.graphics.description = (
  'ROC curve and confusion matrix')
model_card.quantitative_analysis.graphics.collection = [
    mctlib.Graphic(image=roc_curve),
    mctlib.Graphic(image=confusion_matrix)
]

mct.update_model_card(model_card)
Generate model card
# Return the model card document as an HTML page

html = mct.export_format()

display.display(display.HTML(html))