| | |  GitHub এ দেখুন GitHub এ দেখুন | | |
TensorFlow হাব (মেমরি-হাব) শেয়ার মেশিন লার্নিং দক্ষতার পুনর্ব্যবহারযোগ্য সংস্থানে আপনার প্যাকেজ, বিশেষত পূর্ব প্রশিক্ষিত মডিউল করার জন্য একটি প্ল্যাটফর্ম।
এই colab, আমরা একটি মডিউল প্যাকেজ ব্যবহার করবে রঙিন মৃত্পাত্রবিশেষ স্নায়ুর নেটওয়ার্ক এবং ইমেজ প্রক্রিয়াকরণের keypoints এবং তাদের বর্ণনাকারী শনাক্ত করতে যুক্তি। নিউরাল নেটওয়ার্ক ওজন বর্ণনা অনুযায়ী ল্যান্ডমার্কের ইমেজ এ প্রশিক্ষণ প্রদান করা হয়েছে এই কাগজ ।
সেটআপ
pip install scikit-image
from absl import logging

import matplotlib.pyplot as plt
import numpy as np
from PIL import Image, ImageOps
from scipy.spatial import cKDTree
from skimage.feature import plot_matches
from skimage.measure import ransac
from skimage.transform import AffineTransform
from six import BytesIO

import tensorflow as tf

import tensorflow_hub as hub
from six.moves.urllib.request import urlopen
তথ্যটি
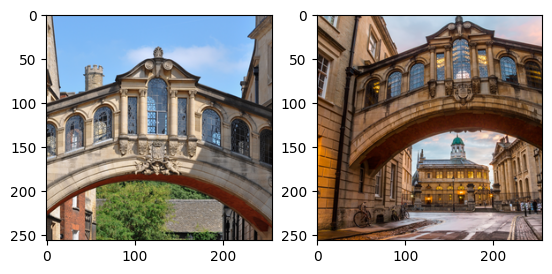
পরবর্তী কক্ষে, আমরা DELF-এর সাথে মিল ও তুলনা করার জন্য আমরা দুটি ছবির URL উল্লেখ করি।
ছবি নির্বাচন করুন
images = "Bridge of Sighs"
if images == "Bridge of Sighs":
  # from: https://commons.wikimedia.org/wiki/File:Bridge_of_Sighs,_Oxford.jpg
  # by: N.H. Fischer
  IMAGE_1_URL = 'https://upload.wikimedia.org/wikipedia/commons/2/28/Bridge_of_Sighs%2C_Oxford.jpg'
  # from https://commons.wikimedia.org/wiki/File:The_Bridge_of_Sighs_and_Sheldonian_Theatre,_Oxford.jpg
  # by: Matthew Hoser
  IMAGE_2_URL = 'https://upload.wikimedia.org/wikipedia/commons/c/c3/The_Bridge_of_Sighs_and_Sheldonian_Theatre%2C_Oxford.jpg'
elif images == "Golden Gate":
  IMAGE_1_URL = 'https://upload.wikimedia.org/wikipedia/commons/1/1e/Golden_gate2.jpg'
  IMAGE_2_URL = 'https://upload.wikimedia.org/wikipedia/commons/3/3e/GoldenGateBridge.jpg'
elif images == "Acropolis":
  IMAGE_1_URL = 'https://upload.wikimedia.org/wikipedia/commons/c/ce/2006_01_21_Ath%C3%A8nes_Parth%C3%A9non.JPG'
  IMAGE_2_URL = 'https://upload.wikimedia.org/wikipedia/commons/5/5c/ACROPOLIS_1969_-_panoramio_-_jean_melis.jpg'
else:
  IMAGE_1_URL = 'https://upload.wikimedia.org/wikipedia/commons/d/d8/Eiffel_Tower%2C_November_15%2C_2011.jpg'
  IMAGE_2_URL = 'https://upload.wikimedia.org/wikipedia/commons/a/a8/Eiffel_Tower_from_immediately_beside_it%2C_Paris_May_2008.jpg'
ডাউনলোড করুন, আকার পরিবর্তন করুন, সংরক্ষণ করুন এবং চিত্রগুলি প্রদর্শন করুন৷
def download_and_resize(name, url, new_width=256, new_height=256):
  path = tf.keras.utils.get_file(url.split('/')[-1], url)
  image = Image.open(path)
  image = ImageOps.fit(image, (new_width, new_height), Image.ANTIALIAS)
  return image
image1 = download_and_resize('image_1.jpg', IMAGE_1_URL)
image2 = download_and_resize('image_2.jpg', IMAGE_2_URL)

plt.subplot(1,2,1)
plt.imshow(image1)
plt.subplot(1,2,2)
plt.imshow(image2)
Downloading data from https://upload.wikimedia.org/wikipedia/commons/2/28/Bridge_of_Sighs%2C_Oxford.jpg
7020544/7013850 [==============================] - 0s 0us/step
7028736/7013850 [==============================] - 0s 0us/step
Downloading data from https://upload.wikimedia.org/wikipedia/commons/c/c3/The_Bridge_of_Sighs_and_Sheldonian_Theatre%2C_Oxford.jpg
14172160/14164194 [==============================] - 1s 0us/step
14180352/14164194 [==============================] - 1s 0us/step
<matplotlib.image.AxesImage at 0x7f333b5e2d10>
ডেটাতে DELF মডিউল প্রয়োগ করুন
DELF মডিউল ইনপুট হিসাবে একটি চিত্র নেয় এবং ভেক্টর সহ উল্লেখযোগ্য পয়েন্টগুলি বর্ণনা করবে। নিম্নলিখিত কক্ষে এই কোলাবের যুক্তির মূল অংশ রয়েছে।
delf = hub.load('https://tfhub.dev/google/delf/1').signatures['default']
def run_delf(image):
  np_image = np.array(image)
  float_image = tf.image.convert_image_dtype(np_image, tf.float32)

  return delf(
      image=float_image,
      score_threshold=tf.constant(100.0),
      image_scales=tf.constant([0.25, 0.3536, 0.5, 0.7071, 1.0, 1.4142, 2.0]),
      max_feature_num=tf.constant(1000))
result1 = run_delf(image1)
result2 = run_delf(image2)
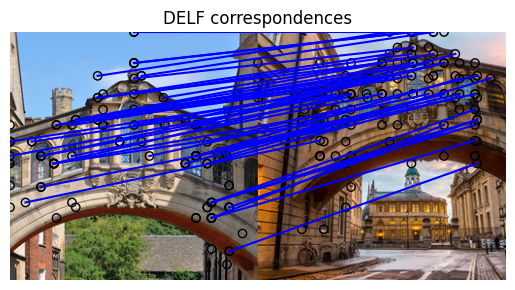
চিত্রের সাথে মেলে অবস্থান এবং বর্ণনা ভেক্টর ব্যবহার করুন
এই পোস্ট-প্রসেসিং এবং ভিজ্যুয়ালাইজেশনের জন্য TensorFlow প্রয়োজন নেই
def match_images(image1, image2, result1, result2):
  distance_threshold = 0.8

  # Read features.
  num_features_1 = result1['locations'].shape[0]
  print("Loaded image 1's %d features" % num_features_1)

  num_features_2 = result2['locations'].shape[0]
  print("Loaded image 2's %d features" % num_features_2)

  # Find nearest-neighbor matches using a KD tree.
  d1_tree = cKDTree(result1['descriptors'])
  _, indices = d1_tree.query(
      result2['descriptors'],
      distance_upper_bound=distance_threshold)

  # Select feature locations for putative matches.
  locations_2_to_use = np.array([
      result2['locations'][i,]
      for i in range(num_features_2)
      if indices[i] != num_features_1
  ])
  locations_1_to_use = np.array([
      result1['locations'][indices[i],]
      for i in range(num_features_2)
      if indices[i] != num_features_1
  ])

  # Perform geometric verification using RANSAC.
  _, inliers = ransac(
      (locations_1_to_use, locations_2_to_use),
      AffineTransform,
      min_samples=3,
      residual_threshold=20,
      max_trials=1000)

  print('Found %d inliers' % sum(inliers))

  # Visualize correspondences.
  _, ax = plt.subplots()
  inlier_idxs = np.nonzero(inliers)[0]
  plot_matches(
      ax,
      image1,
      image2,
      locations_1_to_use,
      locations_2_to_use,
      np.column_stack((inlier_idxs, inlier_idxs)),
      matches_color='b')
  ax.axis('off')
  ax.set_title('DELF correspondences')
match_images(image1, image2, result1, result2)
Loaded image 1's 233 features
Loaded image 2's 262 features
Found 49 inliers