
| | |  GitHub에서 소스 보기 GitHub에서 소스 보기 | |
개요
기계 학습 알고리즘은 일반적으로 계산 비용이 많이 듭니다. 따라서 가장 최적화된 버전의 모델을 실행하고 있는지 확인하려면 기계 학습 애플리케이션의 성능을 수량화하는 것이 중요합니다. TensorFlow 프로파일러를 사용하여 TensorFlow 코드 실행을 프로파일링합니다.
설정
from datetime import datetime
from packaging import version

import os
TensorFlow 프로필러 및 TensorFlow TensorBoard (최신 버전을 필요 >=2.2 ).
pip install -U tensorboard_plugin_profile
import tensorflow as tf

print("TensorFlow version: ", tf.__version__)
TensorFlow version: 2.2.0-dev20200405
TensorFlow가 GPU에 액세스할 수 있는지 확인합니다.
device_name = tf.test.gpu_device_name()
if not device_name:
  raise SystemError('GPU device not found')
print('Found GPU at: {}'.format(device_name))
Found GPU at: /device:GPU:0
TensorBoard 콜백으로 이미지 분류 모델 학습
이 튜토리얼에서는, 당신은에 분류 이미지 모델을 훈련하여 얻을 수있는 성능 프로파일 캡처하여 TensorFlow 프로파일의 기능을 탐구 MNIST 데이터 세트를 .
TensorFlow 데이터 세트를 사용하여 훈련 데이터를 가져와 훈련 및 테스트 세트로 분할합니다.
import tensorflow_datasets as tfds
tfds.disable_progress_bar()
(ds_train, ds_test), ds_info = tfds.load(
    'mnist',
    split=['train', 'test'],
    shuffle_files=True,
    as_supervised=True,
    with_info=True,
)
WARNING:absl:Dataset mnist is hosted on GCS. It will automatically be downloaded to your
local data directory. If you'd instead prefer to read directly from our public
GCS bucket (recommended if you're running on GCP), you can instead set
data_dir=gs://tfds-data/datasets.
Downloading and preparing dataset mnist/3.0.0 (download: 11.06 MiB, generated: Unknown size, total: 11.06 MiB) to /root/tensorflow_datasets/mnist/3.0.0...
Dataset mnist downloaded and prepared to /root/tensorflow_datasets/mnist/3.0.0. Subsequent calls will reuse this data.
픽셀 값을 0과 1 사이로 정규화하여 훈련 및 테스트 데이터를 전처리합니다.
def normalize_img(image, label):
  """Normalizes images: `uint8` -> `float32`."""
  return tf.cast(image, tf.float32) / 255., label

ds_train = ds_train.map(normalize_img)
ds_train = ds_train.batch(128)
ds_test = ds_test.map(normalize_img)
ds_test = ds_test.batch(128)
Keras를 사용하여 이미지 분류 모델을 만듭니다.
model = tf.keras.models.Sequential([
  tf.keras.layers.Flatten(input_shape=(28, 28, 1)),
  tf.keras.layers.Dense(128,activation='relu'),
  tf.keras.layers.Dense(10, activation='softmax')
])
model.compile(
    loss='sparse_categorical_crossentropy',
    optimizer=tf.keras.optimizers.Adam(0.001),
    metrics=['accuracy']
)
TensorBoard 콜백을 만들어 성능 프로필을 캡처하고 모델을 훈련하는 동안 호출합니다.
# Create a TensorBoard callback
logs = "logs/" + datetime.now().strftime("%Y%m%d-%H%M%S")

tboard_callback = tf.keras.callbacks.TensorBoard(log_dir = logs,
                                                 histogram_freq = 1,
                                                 profile_batch = '500,520')

model.fit(ds_train,
          epochs=2,
          validation_data=ds_test,
          callbacks = [tboard_callback])
Epoch 1/2
469/469 [==============================] - 11s 22ms/step - loss: 0.3684 - accuracy: 0.8981 - val_loss: 0.1971 - val_accuracy: 0.9436
Epoch 2/2
 50/469 [==>...........................] - ETA: 9s - loss: 0.2014 - accuracy: 0.9439WARNING:tensorflow:From /usr/local/lib/python3.6/dist-packages/tensorflow/python/ops/summary_ops_v2.py:1271: stop (from tensorflow.python.eager.profiler) is deprecated and will be removed after 2020-07-01.
Instructions for updating:
use `tf.profiler.experimental.stop` instead.
WARNING:tensorflow:From /usr/local/lib/python3.6/dist-packages/tensorflow/python/ops/summary_ops_v2.py:1271: stop (from tensorflow.python.eager.profiler) is deprecated and will be removed after 2020-07-01.
Instructions for updating:
use `tf.profiler.experimental.stop` instead.
469/469 [==============================] - 11s 24ms/step - loss: 0.1685 - accuracy: 0.9525 - val_loss: 0.1376 - val_accuracy: 0.9595
<tensorflow.python.keras.callbacks.History at 0x7f23919a6a58>
TensorFlow Profiler를 사용하여 모델 학습 성능 프로파일링
TensorFlow Profiler는 TensorBoard에 내장되어 있습니다. Colab 매직을 사용하여 TensorBoard를 로드하고 실행합니다. 프로필 탭으로 이동하여 성능 프로파일을 볼 수 있습니다.
# Load the TensorBoard notebook extension.
%load_ext tensorboard
이 모델의 성능 프로필은 아래 이미지와 유사합니다.
# Launch TensorBoard and navigate to the Profile tab to view performance profile
%tensorboard --logdir=logs
<IPython.core.display.Javascript object>
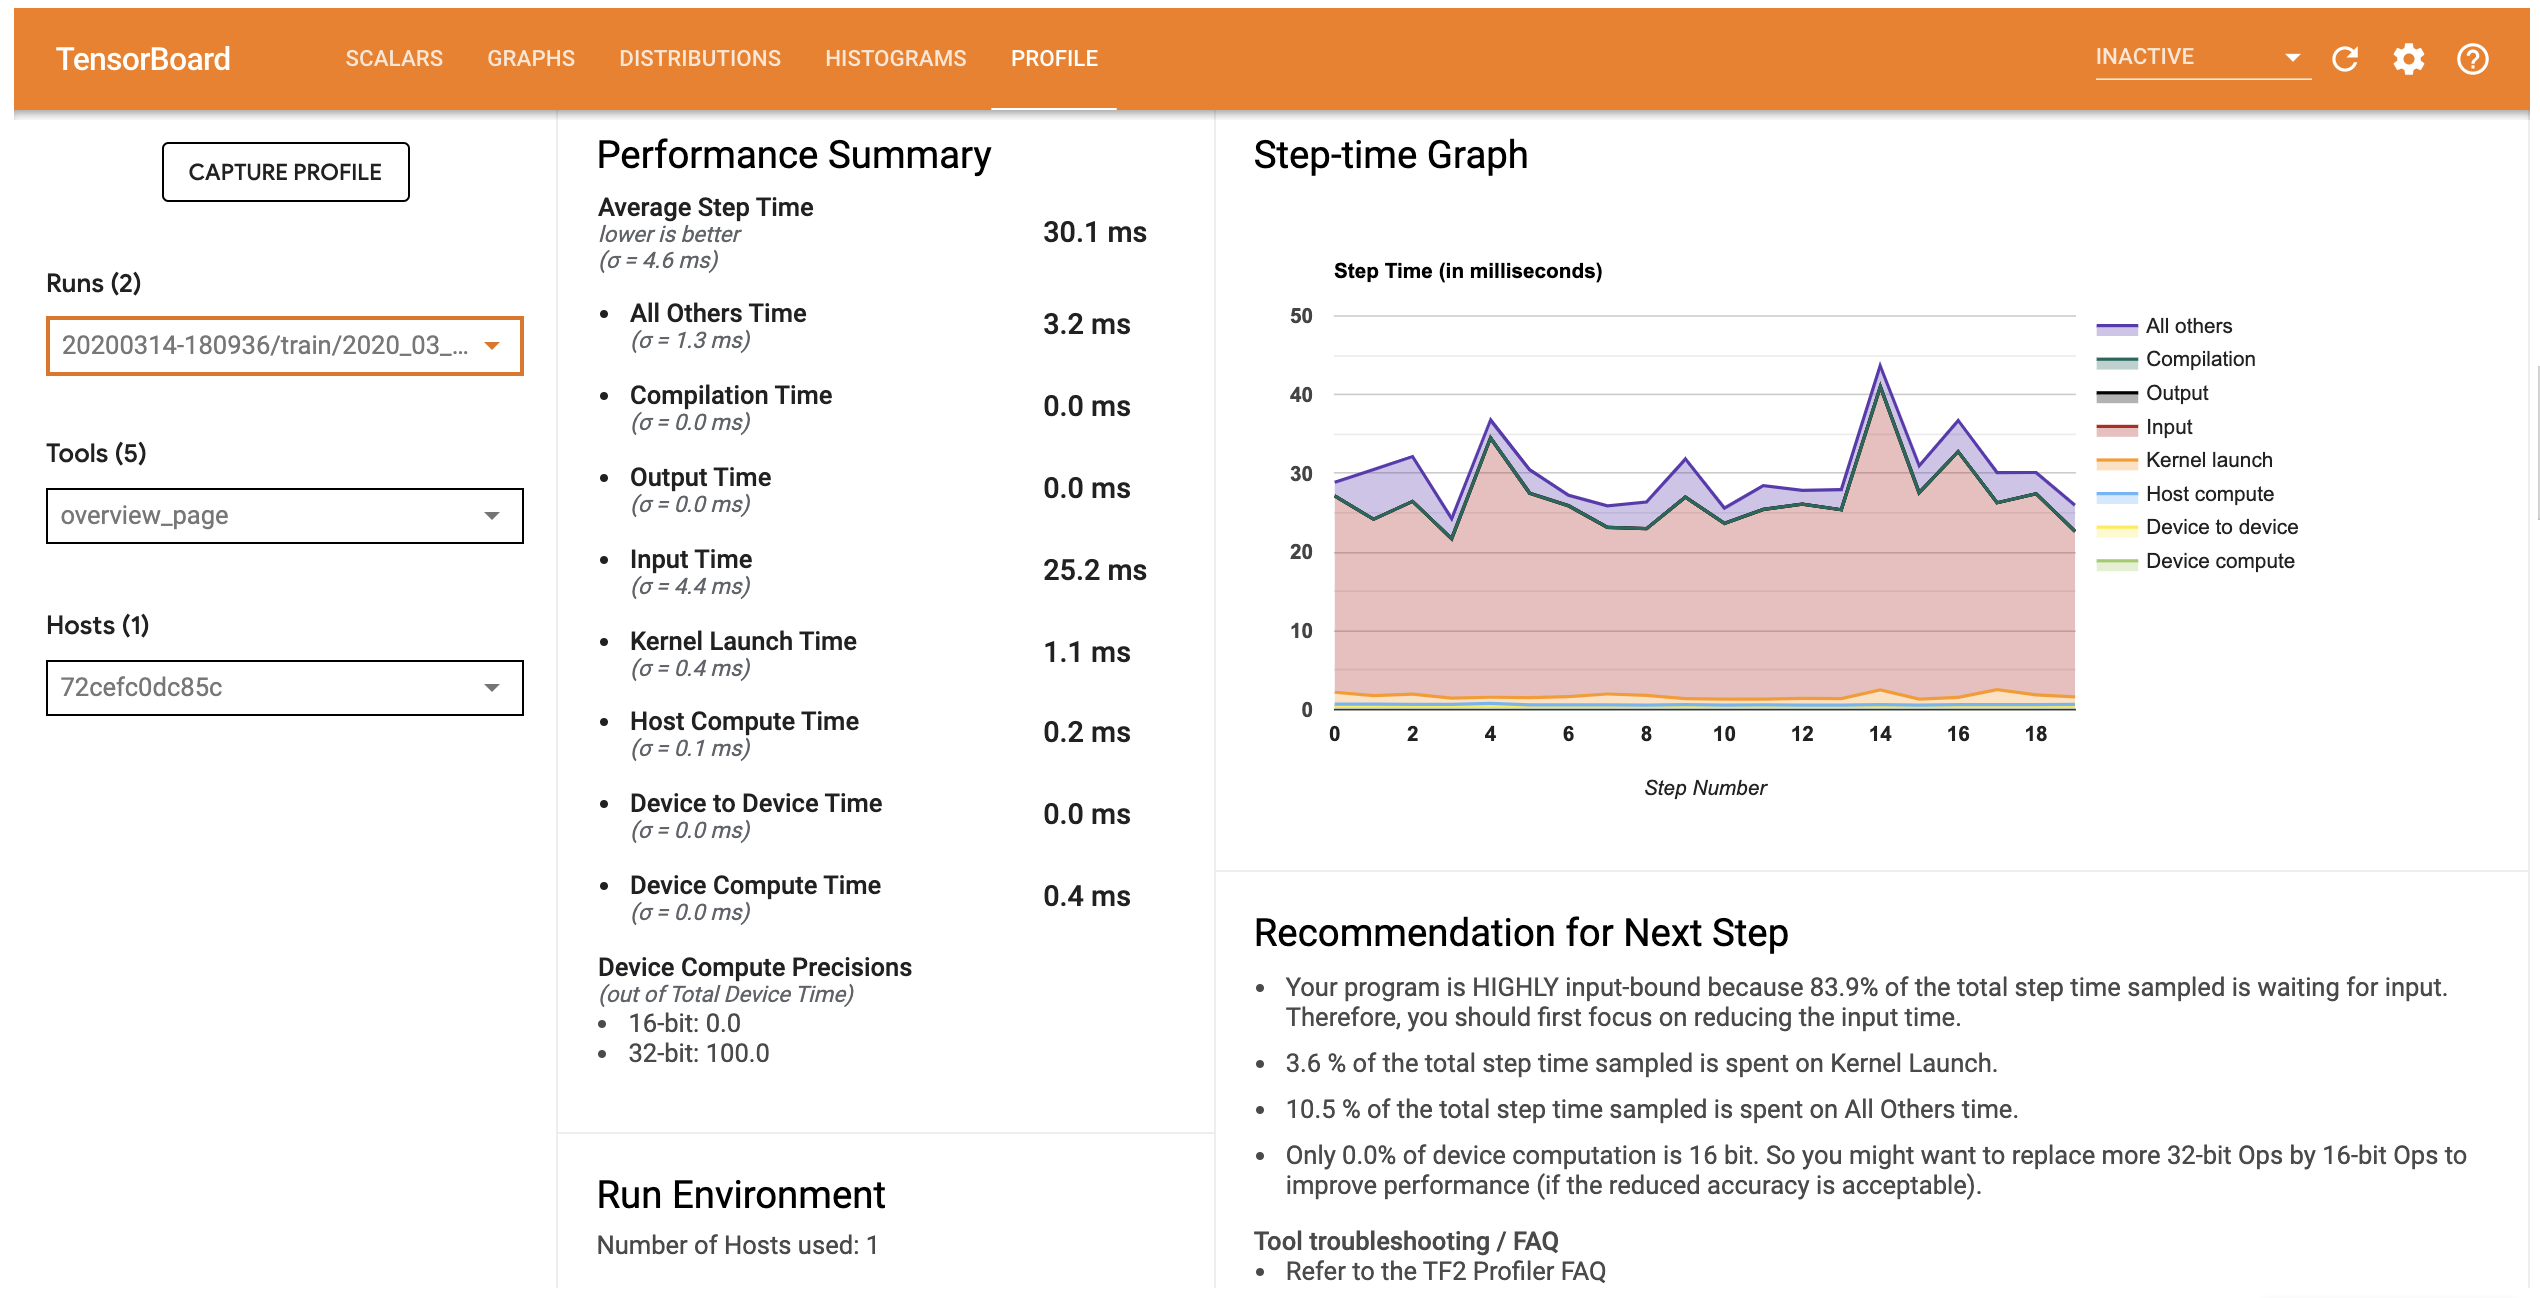
프로필 탭은 쇼 당신에게 모델의 성능에 대한 높은 수준의 요약 개요 페이지를 엽니 다. 오른쪽의 단계-시간 그래프를 보면 모델이 고도로 입력 바운드되어 있음을 알 수 있습니다(즉, 데이터 입력 파이프라인에서 많은 시간을 소비함). 개요 페이지에서는 모델 성능을 최적화하기 위해 따를 수 있는 잠재적인 다음 단계에 대한 권장 사항도 제공합니다.
성능 병목 현상 입력 파이프 라인에서 발생하는 경우, 왼쪽에 드롭 다운 도구에서 추적 뷰어를 선택 이해합니다. Trace Viewer는 프로파일링 기간 동안 CPU와 GPU에서 발생한 다양한 이벤트의 타임라인을 보여줍니다.
Trace Viewer는 세로 축에 여러 이벤트 그룹을 표시합니다. 각 이벤트 그룹에는 추적 이벤트로 채워진 여러 수평 트랙이 있습니다. 트랙은 스레드 또는 GPU 스트림에서 실행되는 이벤트에 대한 이벤트 타임라인입니다. 개별 이벤트는 타임라인 트랙의 색상이 지정된 직사각형 블록입니다. 시간은 왼쪽에서 오른쪽으로 이동합니다. 키보드 단축키를 사용하여 추적 이벤트를 탐색 W (확대)를, S (축소), (스크롤 왼쪽)와 A D (스크롤 오른쪽).
단일 사각형은 추적 이벤트를 나타냅니다. 부동 도구 모음에서 마우스 커서 아이콘을 선택 (또는 키보드 단축키 사용 1 )하고 분석하는 추적 이벤트를 클릭합니다. 시작 시간 및 기간과 같은 이벤트에 대한 정보가 표시됩니다.
클릭 외에도 마우스를 끌어 추적 이벤트 그룹을 선택할 수 있습니다. 그러면 이벤트 요약과 함께 해당 영역의 모든 이벤트 목록이 제공됩니다. 사용 M 선택된 이벤트의 지속 시간을 측정하는 키를 누릅니다.
추적 이벤트는 다음에서 수집됩니다.
- CPU : CPU의 이벤트라는 이벤트 그룹 아래에 표시됩니다
/host:CPU. 각 트랙은 CPU의 스레드를 나타냅니다. CPU 이벤트에는 입력 파이프라인 이벤트, GPU 작업(op) 스케줄링 이벤트, CPU 작업 실행 이벤트 등이 포함됩니다. - GPU : GPU 이벤트는 접두어 이벤트 그룹 아래에 표시됩니다
/device:GPU:. 각 이벤트 그룹은 GPU에서 하나의 스트림을 나타냅니다.
디버그 성능 병목 현상
Trace Viewer를 사용하여 입력 파이프라인에서 성능 병목 현상을 찾습니다. 아래 이미지는 성능 프로필의 스냅샷입니다.
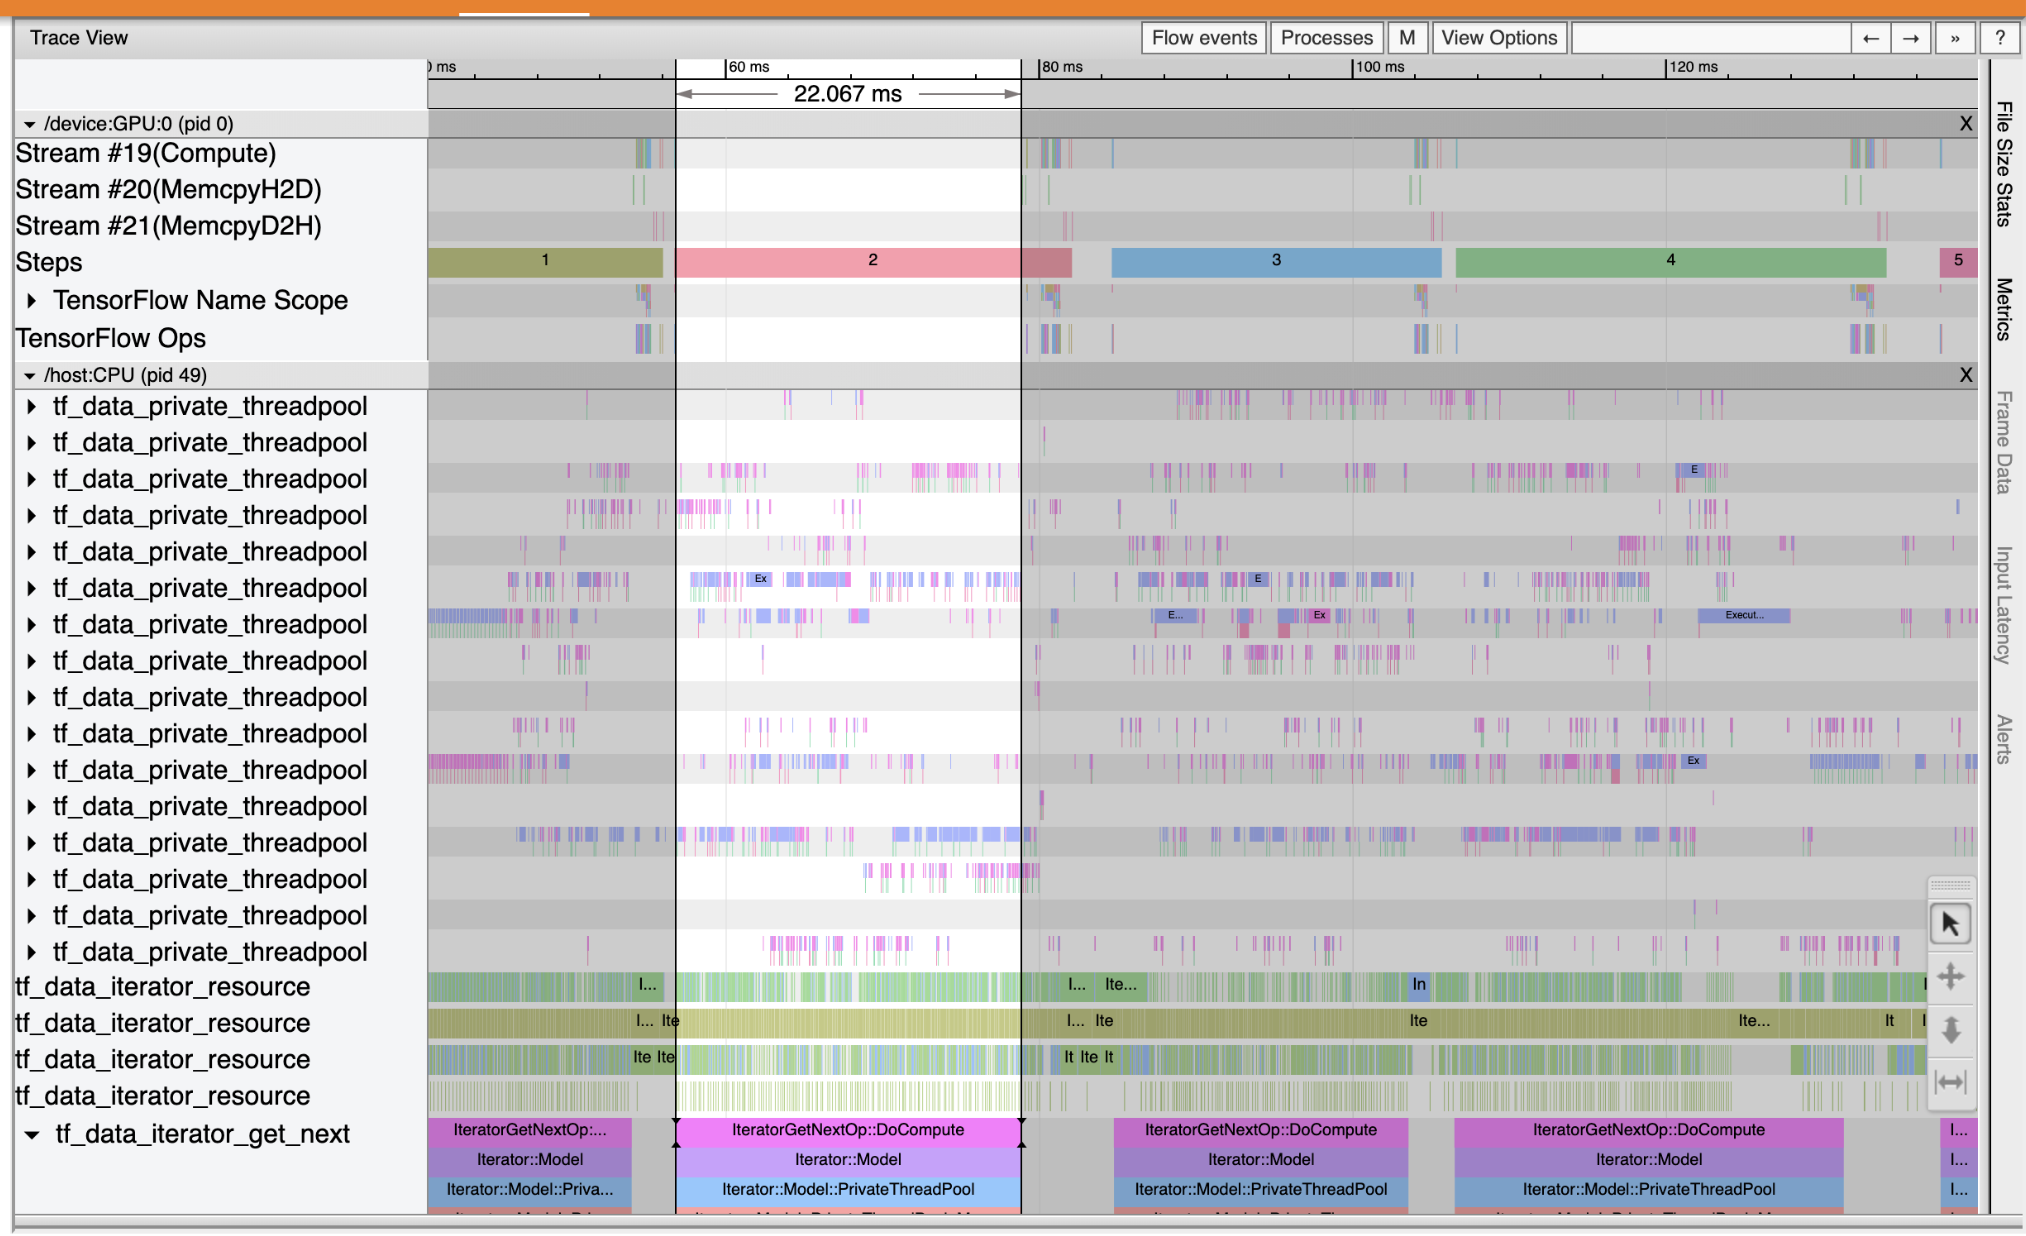
이벤트 흔적을 보면, 당신은 동안 GPU가 비활성화되어 있음을 알 수 tf_data_iterator_get_next 연산은 CPU에서 실행되고 있습니다. 이 작업은 입력 데이터를 처리하고 훈련을 위해 GPU로 보내는 역할을 합니다. 일반적으로 장치(GPU/TPU)를 항상 활성 상태로 유지하는 것이 좋습니다.
사용 tf.data 입력 파이프 라인을 최적화하기 위해 API를. 이 경우 GPU가 처리할 수 있는 데이터가 항상 있는지 확인하기 위해 훈련 데이터 세트를 캐시하고 데이터를 프리페치합시다. 참조 여기에 사용에 대한 자세한 내용은 tf.data 귀하의 의견 파이프 라인을 최적화 할 수 있습니다.
(ds_train, ds_test), ds_info = tfds.load(
    'mnist',
    split=['train', 'test'],
    shuffle_files=True,
    as_supervised=True,
    with_info=True,
)
ds_train = ds_train.map(normalize_img)
ds_train = ds_train.batch(128)
ds_train = ds_train.cache()
ds_train = ds_train.prefetch(tf.data.experimental.AUTOTUNE)
ds_test = ds_test.map(normalize_img)
ds_test = ds_test.batch(128)
ds_test = ds_test.cache()
ds_test = ds_test.prefetch(tf.data.experimental.AUTOTUNE)
모델을 다시 훈련시키고 이전의 콜백을 재사용하여 성능 프로필을 캡처합니다.
model.fit(ds_train,
          epochs=2,
          validation_data=ds_test,
          callbacks = [tboard_callback])
Epoch 1/2
469/469 [==============================] - 10s 22ms/step - loss: 0.1194 - accuracy: 0.9658 - val_loss: 0.1116 - val_accuracy: 0.9680
Epoch 2/2
469/469 [==============================] - 1s 3ms/step - loss: 0.0918 - accuracy: 0.9740 - val_loss: 0.0979 - val_accuracy: 0.9712
<tensorflow.python.keras.callbacks.History at 0x7f23908762b0>
다시 실행 TensorBoard 및 업데이트 된 입력 파이프 라인의 성능 프로파일을 관찰 할 수있는 프로필 탭을 엽니 다.
최적화된 입력 파이프라인이 있는 모델의 성능 프로필은 아래 이미지와 유사합니다.
%tensorboard --logdir=logs
Reusing TensorBoard on port 6006 (pid 750), started 0:00:12 ago. (Use '!kill 750' to kill it.)
<IPython.core.display.Javascript object>
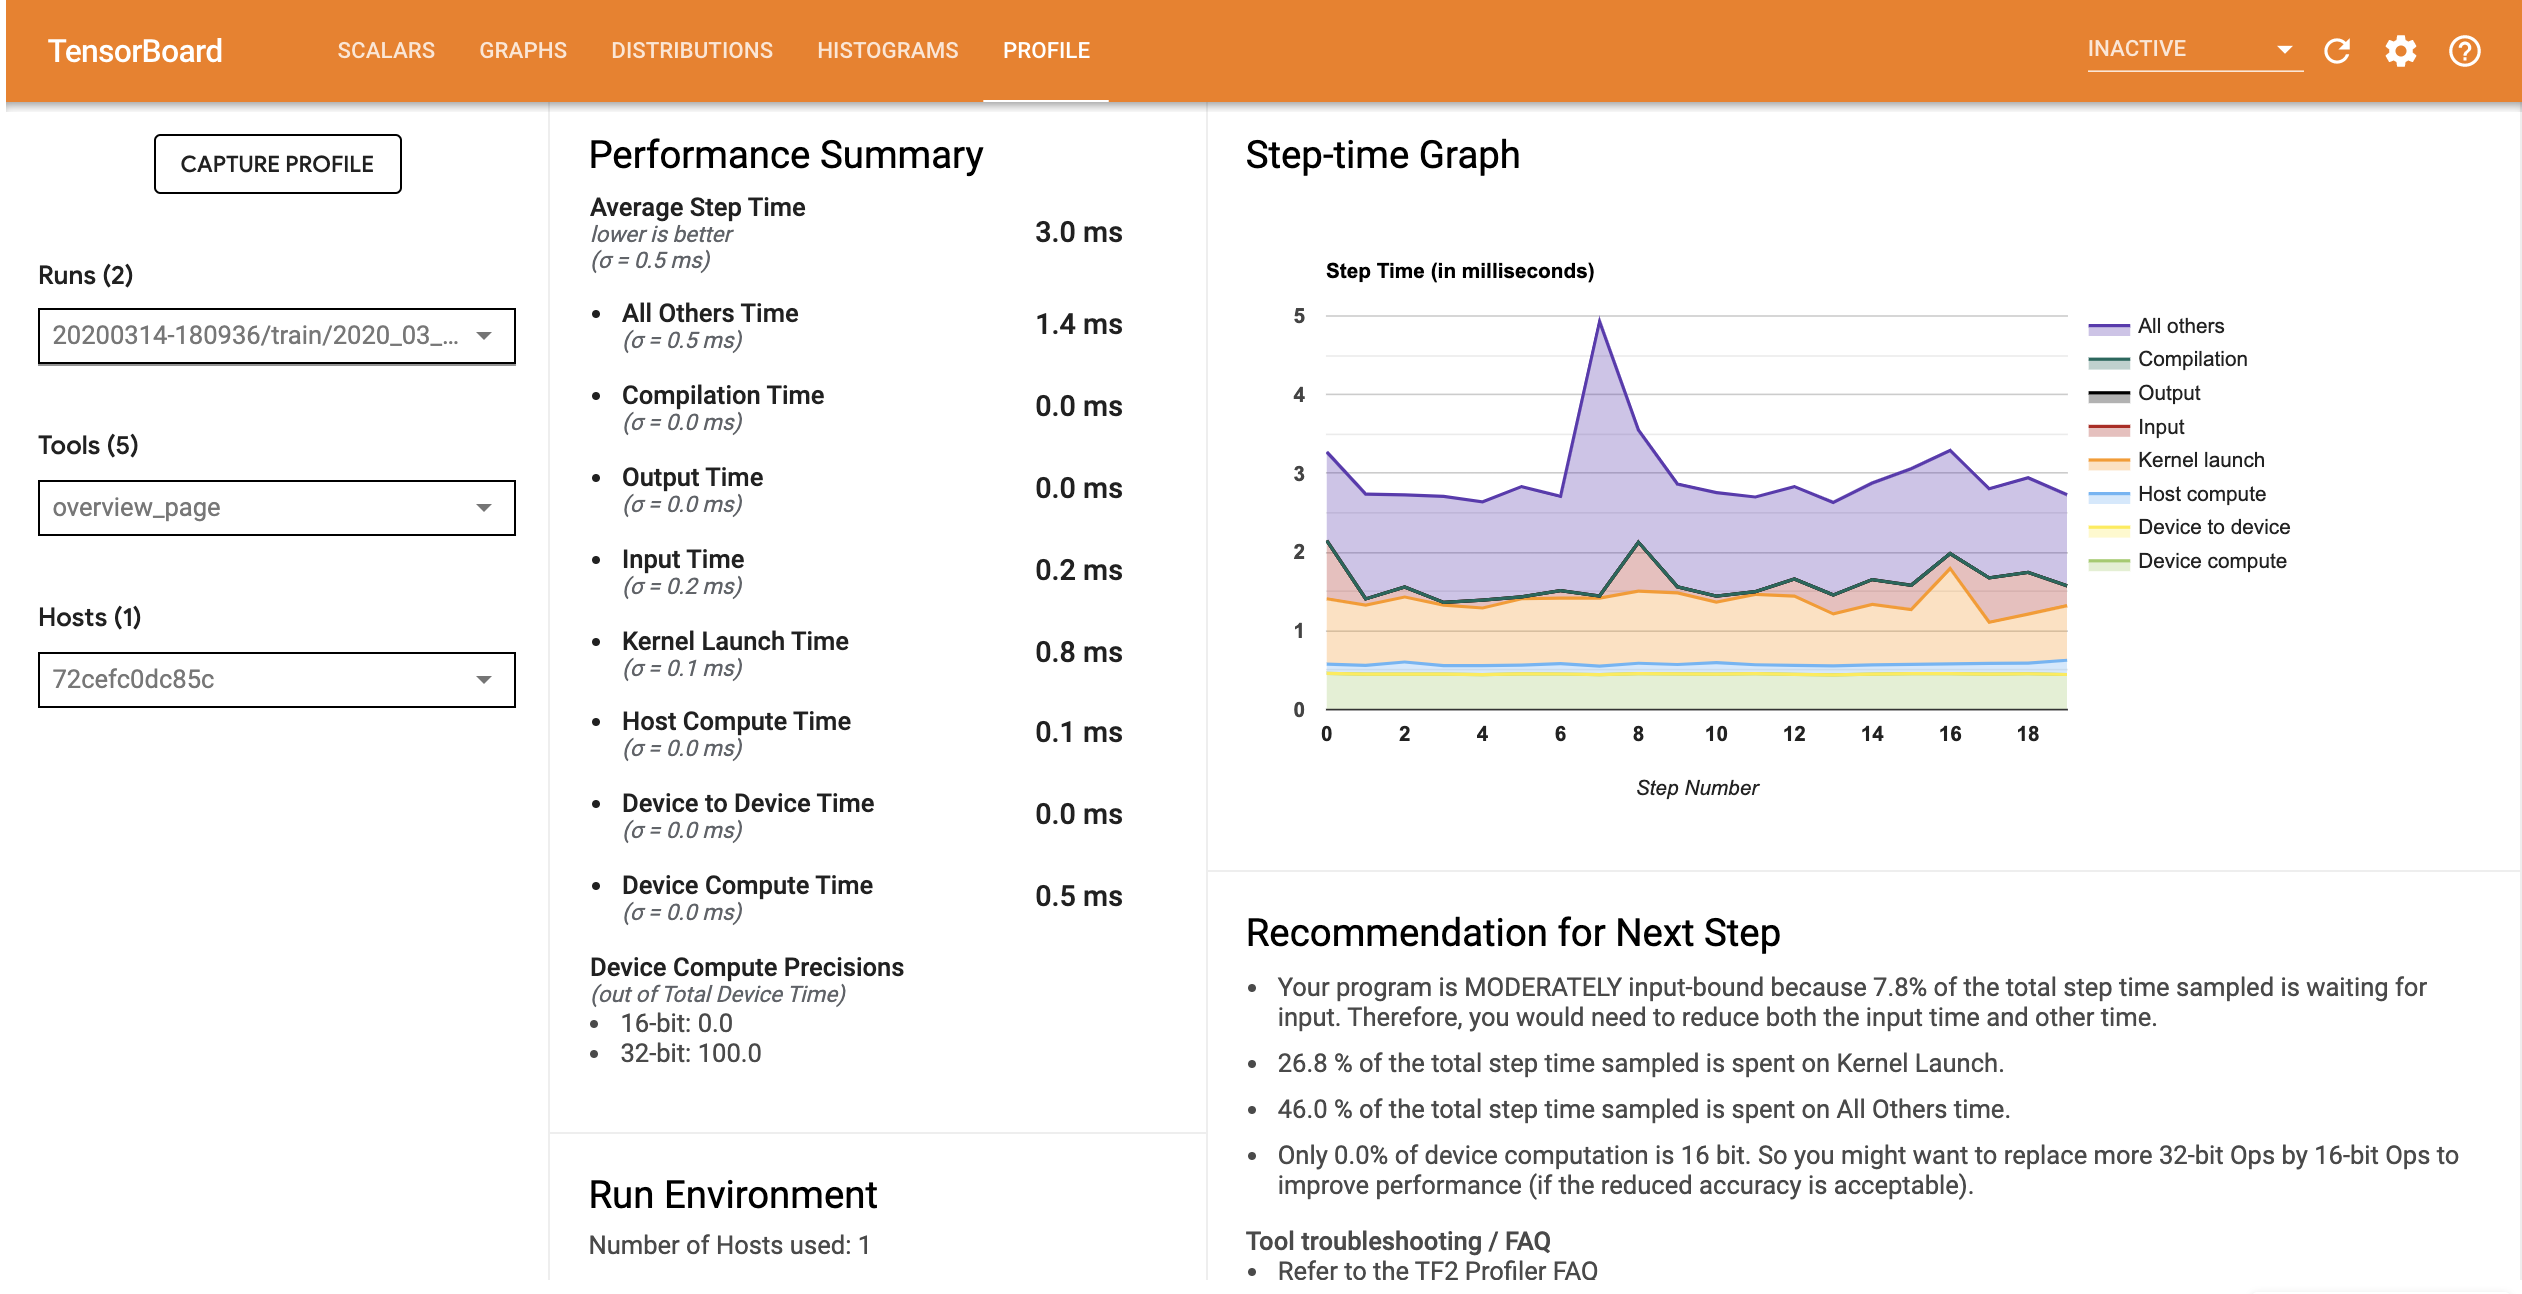
개요 페이지에서 평균 단계 시간이 입력 단계 시간만큼 감소한 것을 볼 수 있습니다. 또한 단계 시간 그래프는 모델이 더 이상 높은 입력 경계가 아님을 나타냅니다. 추적 뷰어를 열어 최적화된 입력 파이프라인으로 추적 이벤트를 검사합니다.
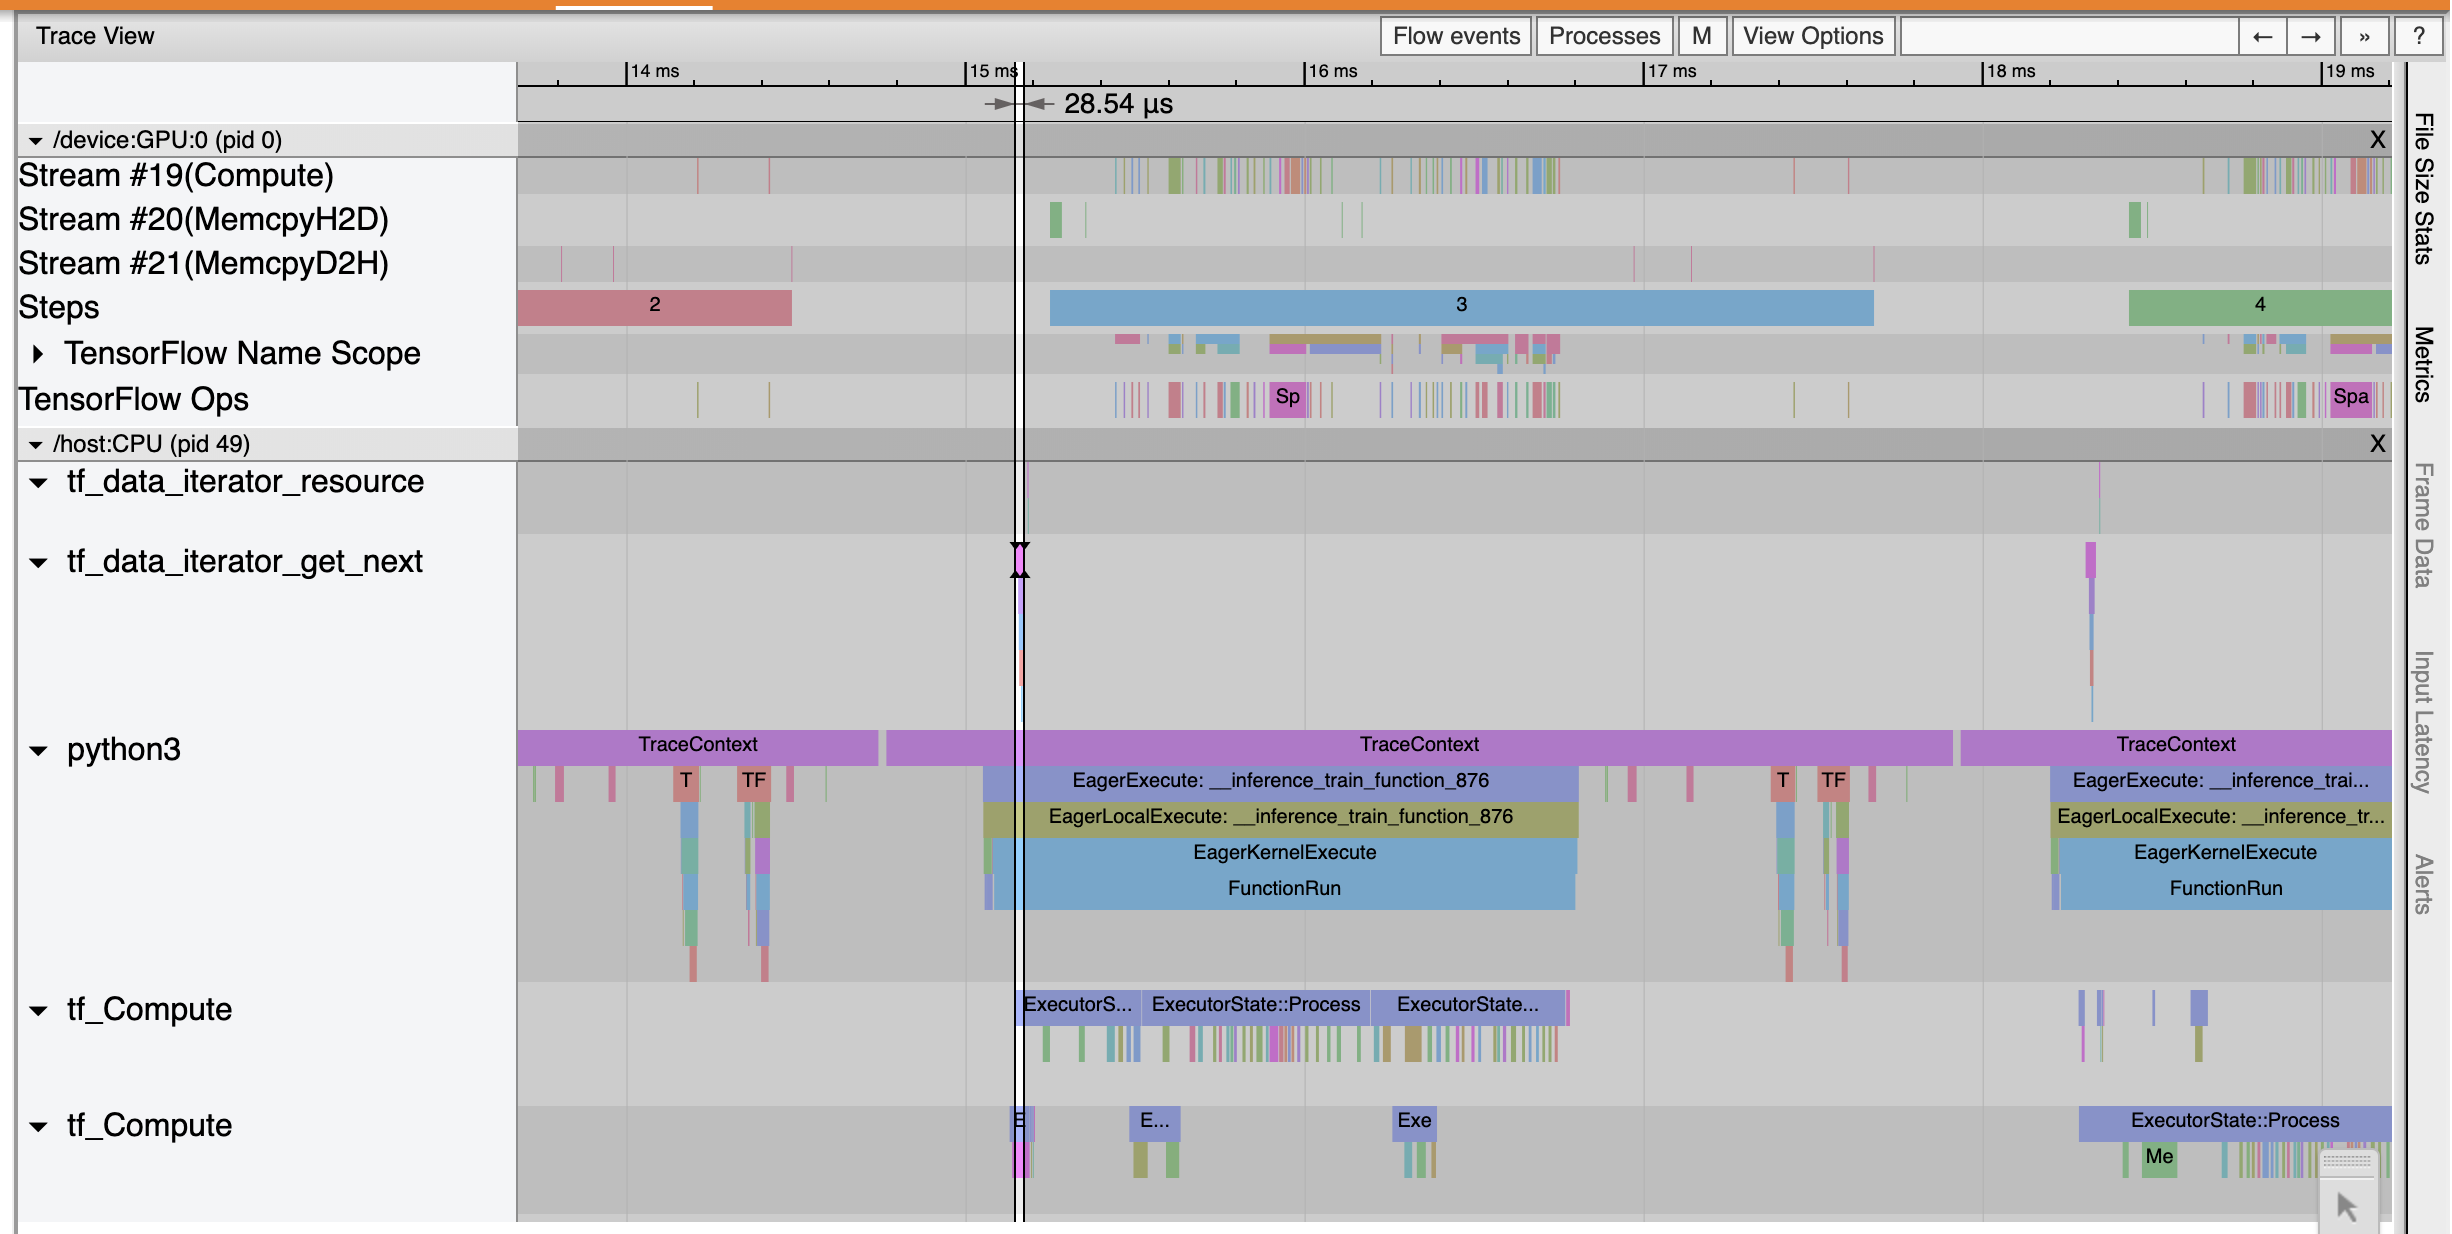
것을 추적 뷰어 프로그램 tf_data_iterator_get_next 영업 이익은 훨씬 빠르게 실행합니다. 따라서 GPU는 훈련을 수행하기 위해 꾸준한 데이터 스트림을 확보하고 모델 훈련을 통해 훨씬 더 나은 활용도를 달성합니다.
요약
TensorFlow Profiler를 사용하여 모델 학습 성능을 프로파일링하고 디버그합니다. 읽기 프로파일 가이드 와 볼 TF 2에서 성능 프로파일 링 TensorFlow 프로파일에 대해 더 알아 보려면 TensorFlow 개발자 서밋 2020에서 이야기.